Automated Response Summary Dashboard
The Automated Response Summary dashboard provides insight into your simple responses, a feature in Automated Response. This dashboard includes visuals of the following data:
- Active and inactive simple responses
- Simple response approval status
- Active simple responses by category
- Simple responses that ran recently
- Top five simple responses triggered
The Automated Response Summary dashboard is only offered to Managed Detection and Response Professional customers. You must have simple responses configured to see data in this dashboard. To learn more about simple responses, see Get Started with Simple Responses.
The Automated Response Summary dashboard is part of the Dashboards feature. For more information about Dashboards, see Dashboards.
Access the Automated Response Summary dashboard
To access the Automated Response Summary dashboard, in the Alert Logic console, click the menu icon (![]() ), and then click
), and then click ![]() Dashboards. Click the drop-down menu on the top left to see the list of available dashboards, and then click Automated Response Summary.
Dashboards. Click the drop-down menu on the top left to see the list of available dashboards, and then click Automated Response Summary.
Automated Response Summary visuals
If available, you can click Investigate in the visuals to be redirected to the corresponding page in the Alert Logic console and take further action if necessary. You can hover over an item in a visual to see a tooltip. Click an item to be redirected to the corresponding page in the Alert Logic console with the data already filtered for you.
For visuals with information in a list, you can click Export to CSV to export the data in CSV format.
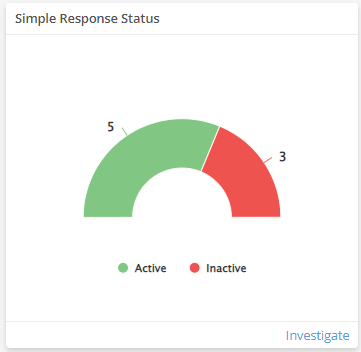
Simple Response Status
This visual provides the counts of active and inactive simple responses. Click an item in the visual to see specific data related to that status in the Simple Responses page.
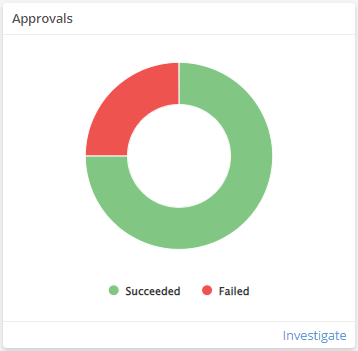
Approvals
This visual indicates the counts of simple response approval requests that succeeded or failed. Click an item in the visual to see specific data related to that status in the Approvals page.
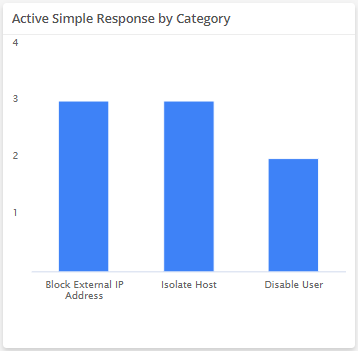
Active Simple Response by Category
This visual provides a bar graph for the current count of active simple responses in each category. Click an item in the visual to see specific data related to that status in the Simple Responses page.
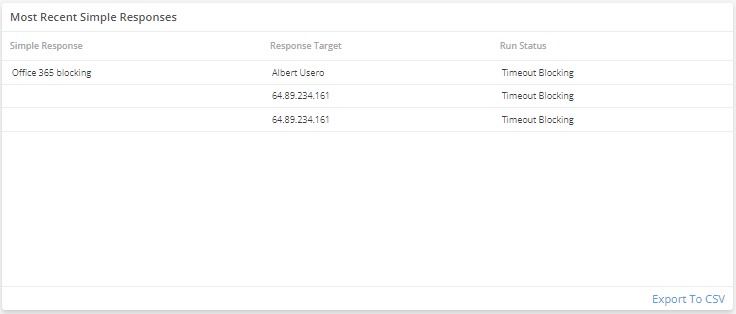
Most Recent Simple Responses
This visual provides a list of the 10 most recent simple responses that ran in your customer account, their target, and their run status. Click Export to CSV to export the data in CSV format. You can view the run history of all simple responses from the Simple Response History page.
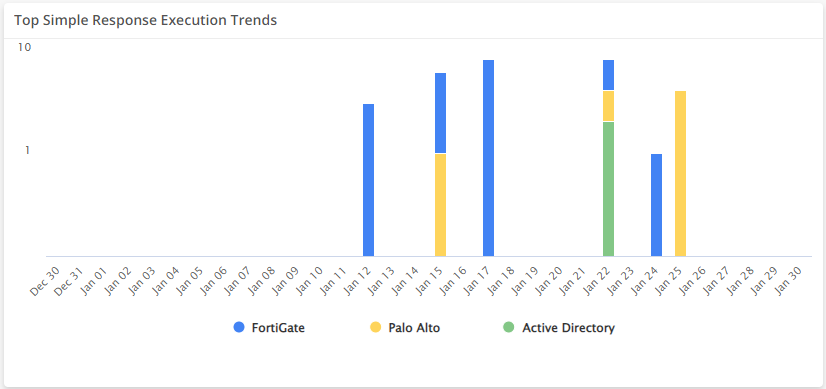
Top Simple Response Execution Trends
This visual provides a bar graph that shows the top five simple responses that ran in your customer account in the selected time range by day. Click an item in the visual to go to the Simple Responses page and view all simple responses.