File Integrity Monitoring Dashboard
The File Integrity Monitoring dashboard provides a summary of your file monitoring activity and issues found in your environment. Use this dashboard to gain insights into your file monitoring scope and status, focus your resources on specific systems or users that may need further investigation, and identify patterns or anomalies in your environment. To learn more about File Integrity Monitoring (FIM), see File Integrity Monitoring .
The File Integrity Monitoring dashboard is only offered to Managed Detection and Response Professional customers. To learn more about Alert Logic subscriptions, see Get Started with Alert Logic Subscriptions and Add-ons.
Access the File Integrity Monitoring dashboard
To access the File Integrity Monitoring dashboard, in the Alert Logic console, click the menu icon (![]() ), and then click
), and then click ![]() Dashboards. Click the drop-down menu on the top left to see the list of available dashboards, and then click File Integrity Monitoring.
Dashboards. Click the drop-down menu on the top left to see the list of available dashboards, and then click File Integrity Monitoring.
FIM visuals
You can click CONFIGURE in the visuals to be redirected to the corresponding page in the Alert Logic console and to take further action if necessary. You can also hover over an item in a visual to see a tooltip with additional details. You can also click items in the visuals to be redirected to the corresponding page in the Alert Logic console and to take further action if necessary. The corresponding page is already filtered with the data from the visual you clicked.
For visuals with information in a list, you can click Export To CSV to export the data in CSV format.
Select date range
You can filter the date range you want to see in the visuals. Choose 7d, 14d, or 30d to view data for the last 7 days, 14 days, or 30 days. You can also click the calendar icon (![]() ) to select a customized date range with a specific start date.
) to select a customized date range with a specific start date.
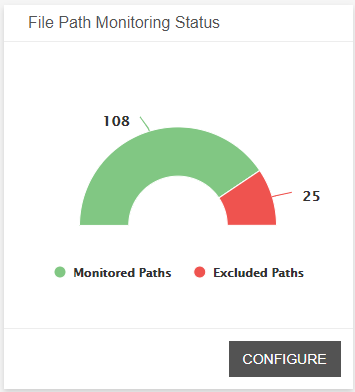
File Path Monitoring Status
This visual provides the current count of monitored paths and the count of excluded paths. Click CONFIGURE to be redirected to the Deployments page, and then select the deployment for which you want to view FIM.
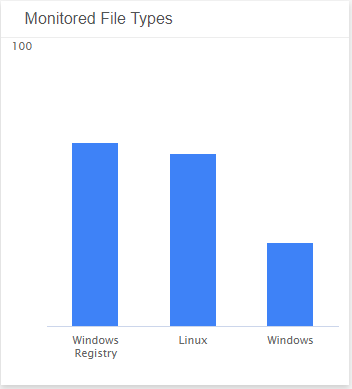
Monitored File Types
This visual provides a bar graph for the current count of monitored files paths in each system file.
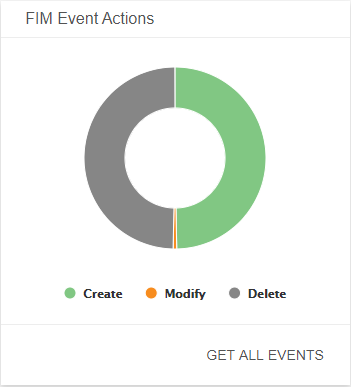
FIM Event Actions
This visual provides a donut chart for the count of actions (create, modified, delete) performed on the files you are monitoring during the specified date range. Click GET ALL EVENTS, and then click the download icon (![]() ) to export data of all of the actions in CSV format.
) to export data of all of the actions in CSV format.
The CSV download contains a maximum of 500,000 events. If you need to export more events, change the date range to return narrow results within certain time periods.
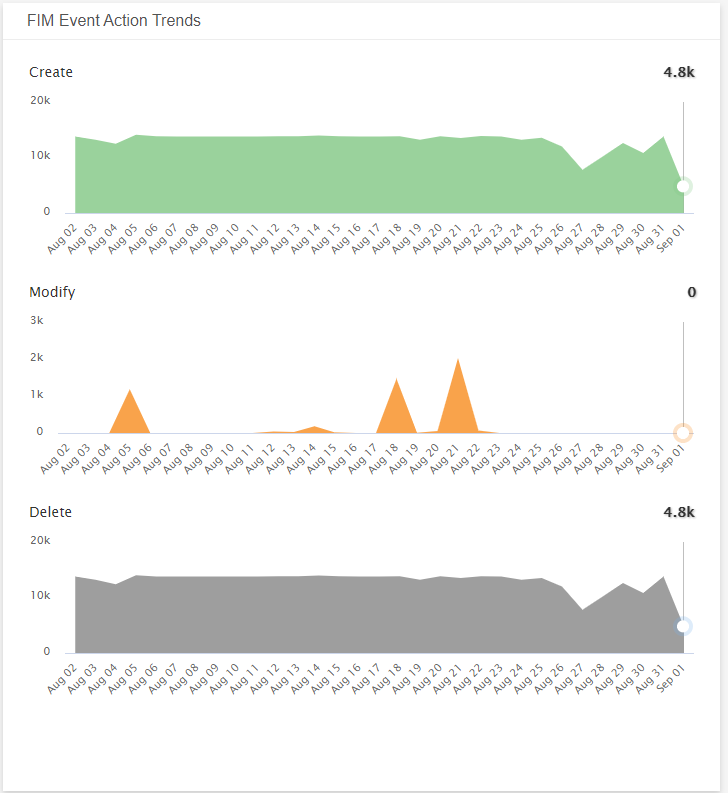
FIM Event Actions Trends
This visual provides a graph for the actions you performed on the files during the specified date range.
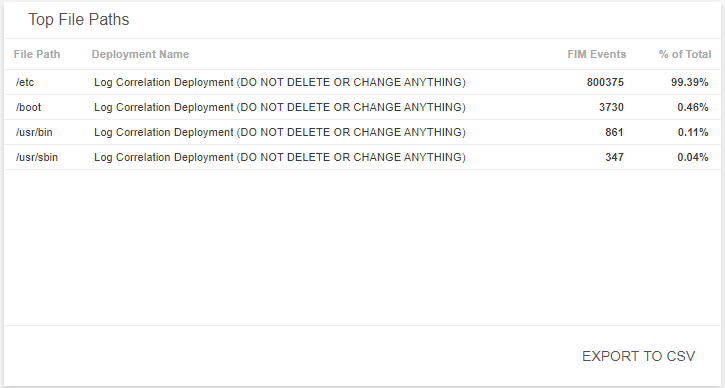
Top File Paths
This visual provides a list of the file paths associated with the highest event count in your deployment and the total percentage of events. Click Export To CSV to export the data in CSV format.
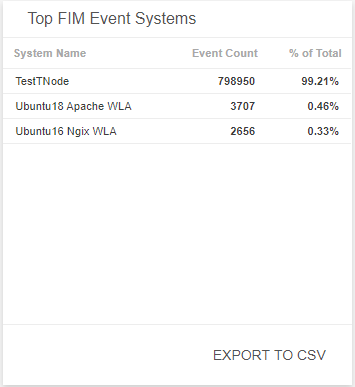
Top FIM Events Systems
This visual provides a list of the systems associated with the highest event count and the percentage of total events. Click Export To CSV to export the data in CSV format.