Managed Accounts Health Summary Dashboard
The Managed Accounts Health Summary dashboard summarizes and provides insights into the health status from the previous day of the accounts you manage. The visuals include information about unhealthy appliances and agents, unprotected nodes, missing agents, and configuration remediations. Use this dashboard to quickly identify unhealthy accounts, patterns, and anomalies that require immediate response or further investigation, and then make necessary changes. This dashboard includes visuals of the following data:
- Change amount and percentage of appliances and agents that have significant issues, unprotected nodes, hosts with missing agents, and the average age of configuration remediations
- Scorecards of statuses for collection assets, network protection, and configuration remediations for each account
- Top accounts with the most unhealthy appliances, most unhealthy agents, highest unprotected networks, and highest missing agents
The Managed Accounts Security Summary dashboard is an additional dashboard only offered to partners and customers with managed accounts. To learn about the other dashboard offered to partners and customers with managed accounts, see Managed Accounts Security Summary Dashboard. For customers with single accounts, see Dashboards.
Access the Managed Accounts Health Summary dashboard
To access the Managed Accounts Health Summary dashboard, in the Alert Logic console, click the menu icon (![]() ), and then click
), and then click ![]() Dashboards. Click the drop-down menu on the top left to see the list of available dashboards, and then click Managed Accounts Health Summary.
Dashboards. Click the drop-down menu on the top left to see the list of available dashboards, and then click Managed Accounts Health Summary.
Managed Accounts Health Summary visuals
You can hover over an item in a visual to see a tooltip with additional details. You can also click items in the visuals to be redirected to the corresponding page in the Alert Logic console and to take further action if necessary. The corresponding page is already filtered with the data from the visual you clicked.
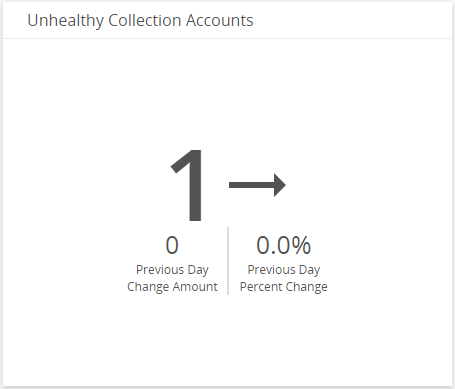
Unhealthy Collections Accounts
This visual provides the change amount and percentage of the total number of accounts with unhealthy agents or appliances with significant issues since the previous day.
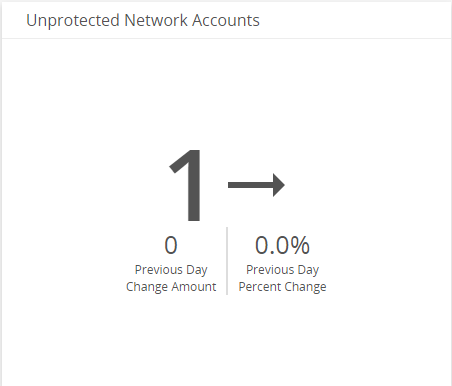
Unprotected Network Accounts
This visual provides the total number of accounts with unprotected networks since the previous day.
Total Hosts Missing Agents
This visual provides the change amount and percentage of hosts with missing agents in your accounts combined since the previous day.

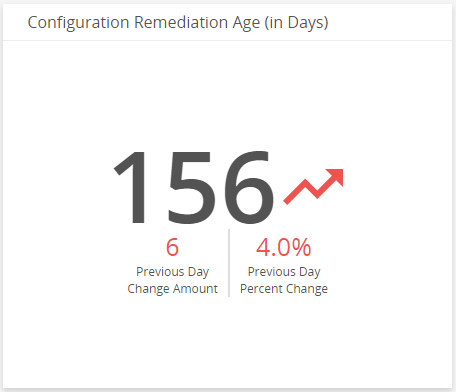
Configuration Remediation Age (in Days)
This visual provides the change amount and percentage of the average days that the configuration remediations went unresolved in your accounts combined since the previous day.
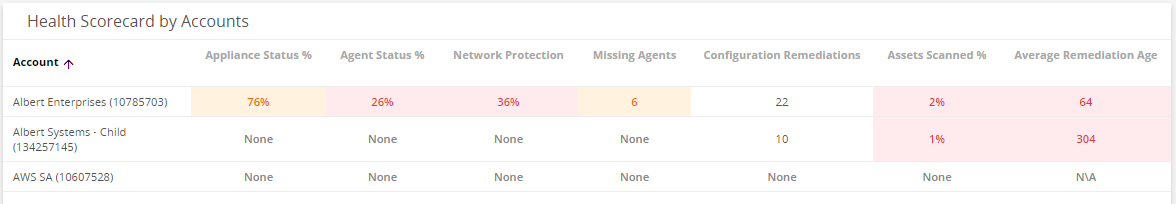
Health Scorecard by Accounts
This color-coded table provides the following data for each of your accounts since the previous day:
- Percentage of current healthy appliances with no significant issues
- Percentage of current healthy agents with no significant issues
- Percentage of current networks with protection enabled
- Count of current hosts with no agent installed
- Count of current open configuration remediations
- Percentage of current assets that have been scanned
- Count of average number of days configuration remediations went unresolved
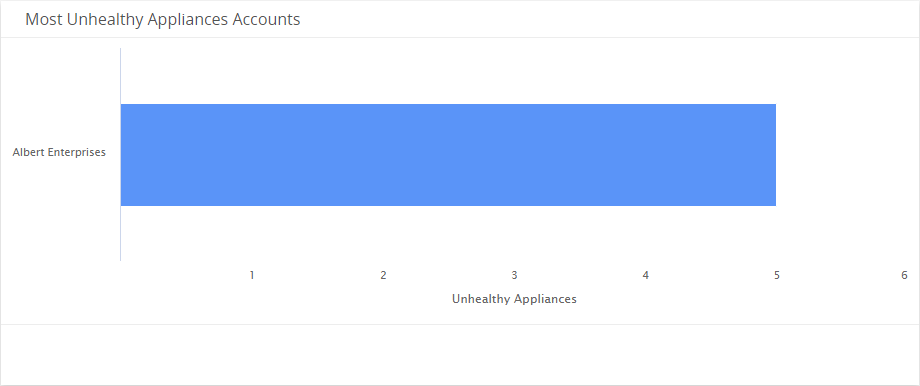
Most Unhealthy Appliances Accounts
This visual provides a bar graph that shows the top accounts with the most appliances that have significant issues.
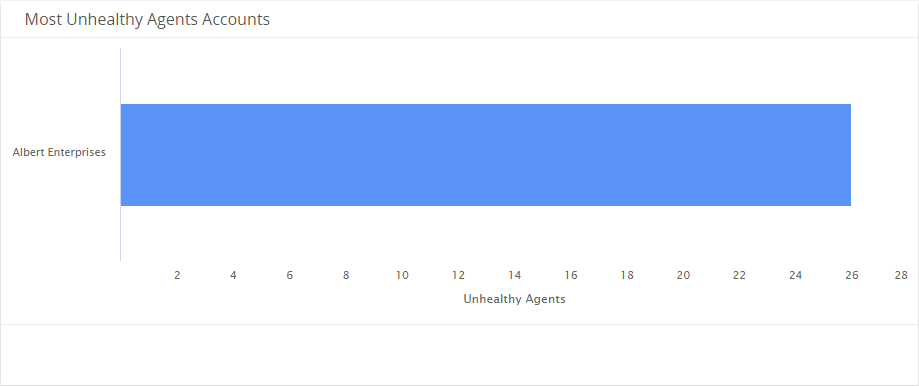
Most Unhealthy Agents Accounts
This visual provides a bar graph that shows the top accounts with the most agents that have significant issues.
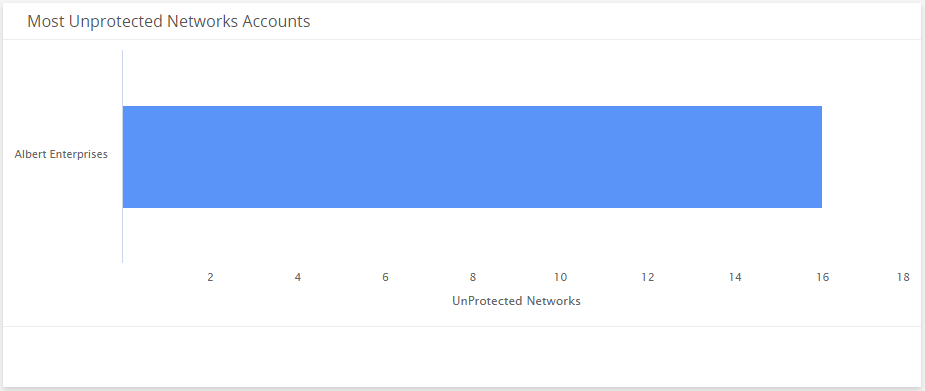
Most Unprotected Networks Accounts
This visual provides a bar graph that shows the top accounts with the most unprotected networks.
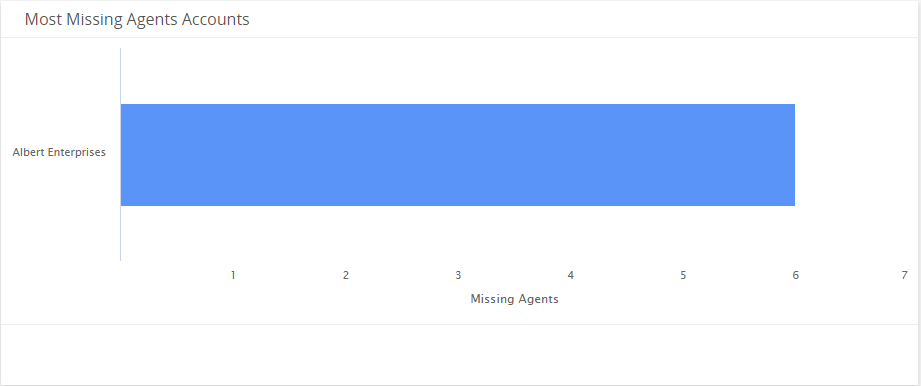
Most Missing Agents Accounts
This visual provides a bar graph that shows the accounts with the most hosts with missing agents.