Monthly Enterprise Risk
The Monthly Enterprise Risk report provides valuable insights and analysis of your incidents, events, and vulnerabilities in your environment. Use this report to evaluate threats and incidents, and your response efforts, validate events and focus your efforts, and gain insights into the effectiveness of your vulnerability management.
This report presents data for an entire month, which immediately becomes available in the beginning of the following month.
To access the Monthly Enterprise report:
- In the Alert Logic console, click the menu icon (
 ), and then click
  Validate.
 - Click Reports, and then click Risk.
- Under Enterprise Risk, click VIEW.
- Click Monthly Enterprise Risk.
Filter the report
To refine your findings, filter your report by Select Month, Customer Account, and Deployment Name.
Filter the report using drop-down menus
By default, Alert Logic includes (All) values for most filters in the report.
To add or remove filter values:
- Click the drop-down menu in the filter, and then select or clear values.
- Click Apply.
Schedule the report
After you finish setting up the report, you can use CREATE REPORT to run it periodically and subscribe users or an integration (such as a webhook) to receive a notification when the report is generated. To learn how to schedule the report and subscribe notification recipients, see Scheduled Reports and Notifications.
Incidents
The Incidents section provides visibility into threats and incidents in your environment, including incident statuses, threat levels, MITRE classification, and daily incident count for the selected month.
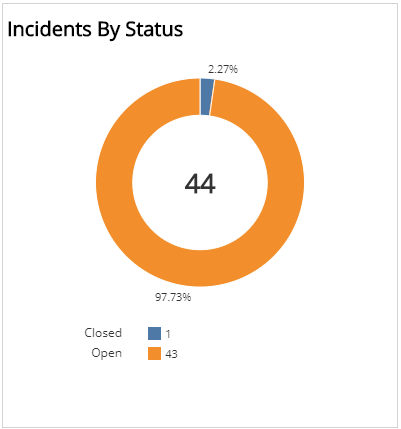
Incidents by Status section
This section provides the count and percentages for open, snoozed, and closed incidents for the selected month.
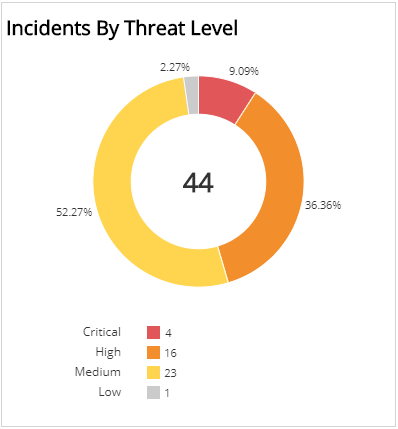
Incidents by Threat Level section
This section provides the count and percentages of incidents in each threat level for the selected month.
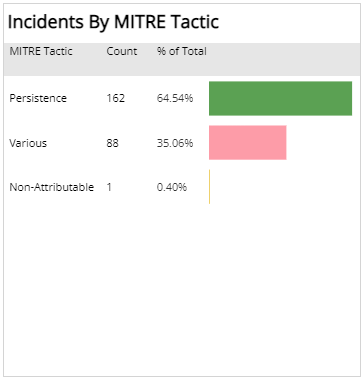
Incidents by MITRE Tactic section
This section provides the count and percentages for each incident by MITRE Tactic in a color-coded bar graph for the selected month.
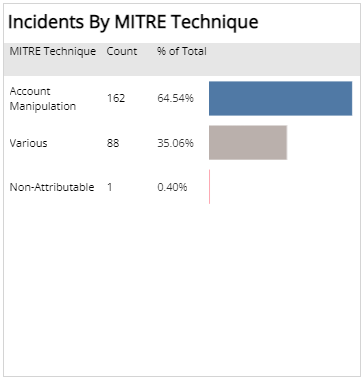
Incidents by MITRE Technique
This section provides the count and percentages for each incident by MITRE Technique in a color-coded bar graph for the selected month.
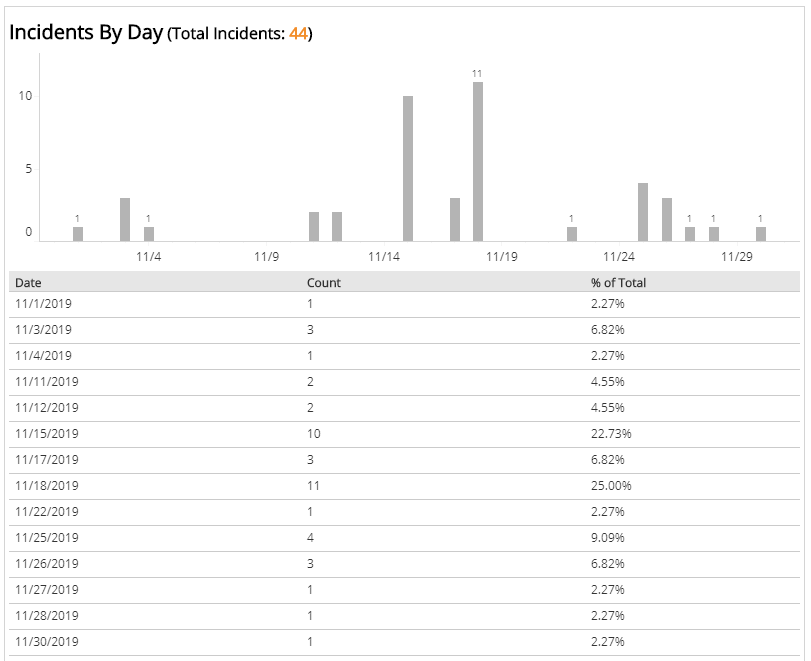
Incident by Day section
This section displays a bar graph of the daily incident count, and a list with the count and total percentage of incidents on each day for the selected month.
Events
The Events section provides visibility into Network IDS events processed in your environment, including event classification, top signatures, and events per day for the selected month.
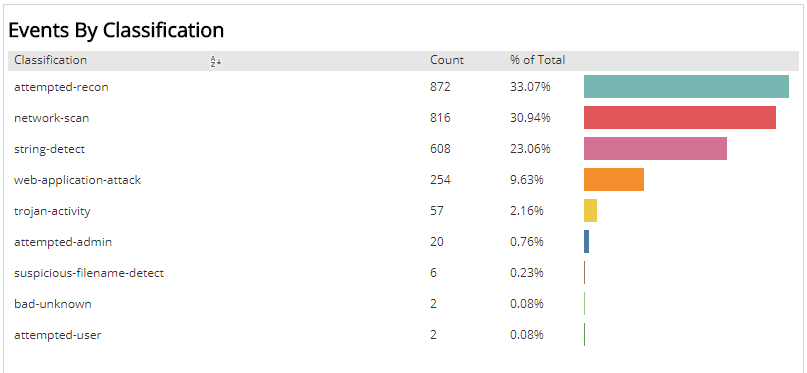
Events by Classification section
This section displays the classifications of events, the count and the percentage for each event classification in a color-coded bar graph for the selected month.
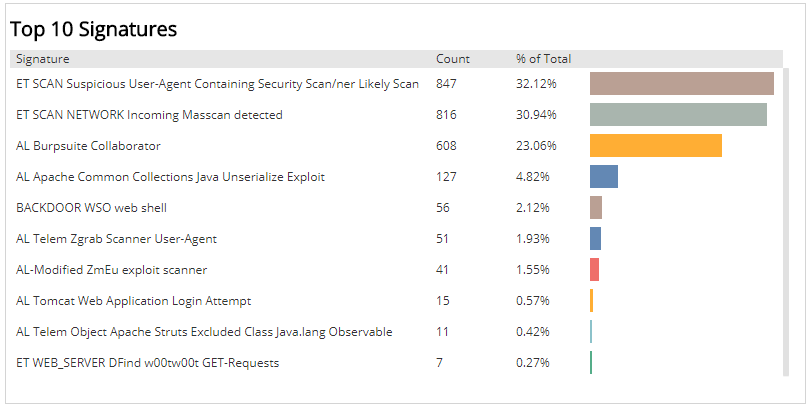
Top 10 Signatures section
This section displays the top ten signatures, the event count and the total percentage of events for each signature, in a color-coded bar graph for the selected month.
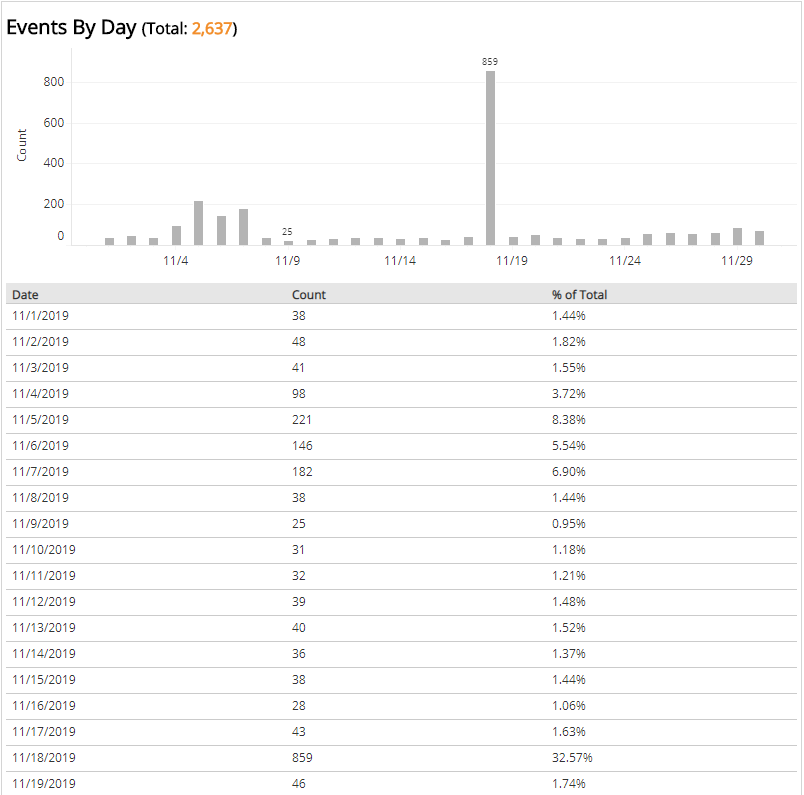
Events by Day section
This section displays a bar graph of the daily event count, and a list with the count and total percentage of events on each day for the selected month.
Vulnerabilities
The Vulnerabilities section provides insights into vulnerabilities and vulnerable assets found in your environment, including vulnerabilities by severity and age, top vulnerable hosts lists, and vulnerabilities by day and severity for the selected month.
In this section, Alert Logic measures the CVSS severity category based on the CVSS score.
Alert Logic assigns
| Severity rating | CVSS v2 score range | CVSS v3 score range |
|---|---|---|
|
|
Not applicable | 9.0 - 10.0 |
|
|
7.0 - 10.0 | 7.0 - 8.9 |
|
|
4.0 - 6.9 | 4.0 - 6.9 |
|
|
0.1 - 3.9 | 0.1 - 3.9 |
|
|
0.0 | 0.0 |
Some vulnerabilities in the National Vulnerability Database have both CVSS v2 and CVSS v3 scores. Alert Logic displays the newer CVSS v3 score and severity rating in prominent locations and both scores in detail views. If only one CVSS score exists, Alert Logic uses that score and severity rating.
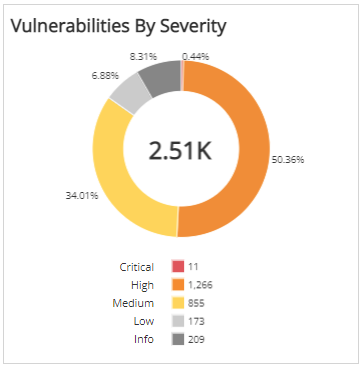
Vulnerabilities by Severity section
This section provides the vulnerability count in each CVSS severity category for the selected month.
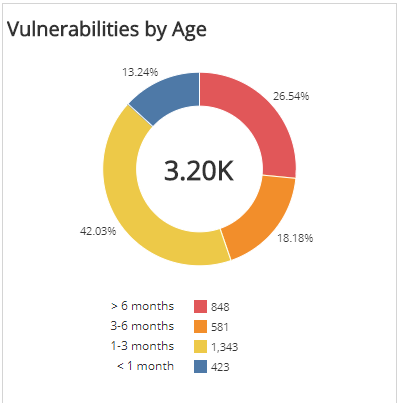
Vulnerabilities by Age section
This section provides the vulnerability count in each age category for the selected month.
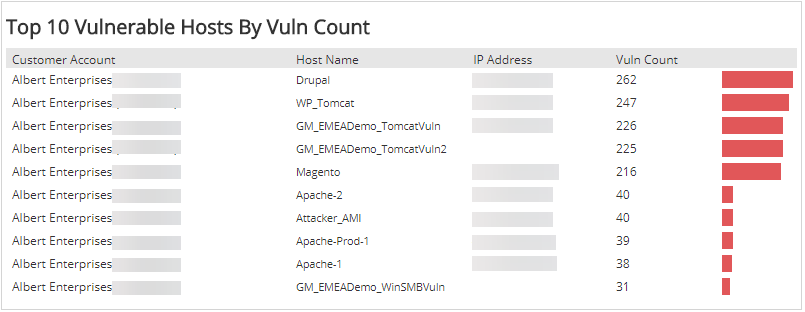
Top 10 Vulnerable Hosts by Vuln Count section
The list provides the ten most vulnerable hosts based on the total vulnerability count during the selected month. The list is organized by customer account, host name, host IP address, count of vulnerabilities, and a bar graph representing the vulnerable host count.
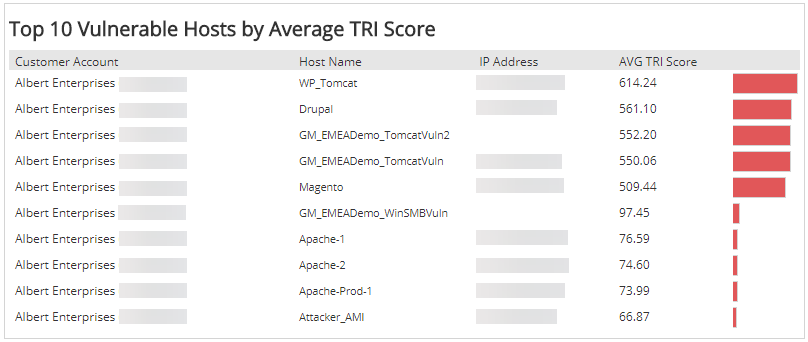
Top 10 Vulnerable Hosts by Average TRI Score section
The list provides the ten most vulnerable hosts based on the Threat Risk Index (TRI) score during the selected month. The list is organized by customer account, host name, host IP address, average TRI score, and bar graph representing the average TRI score.
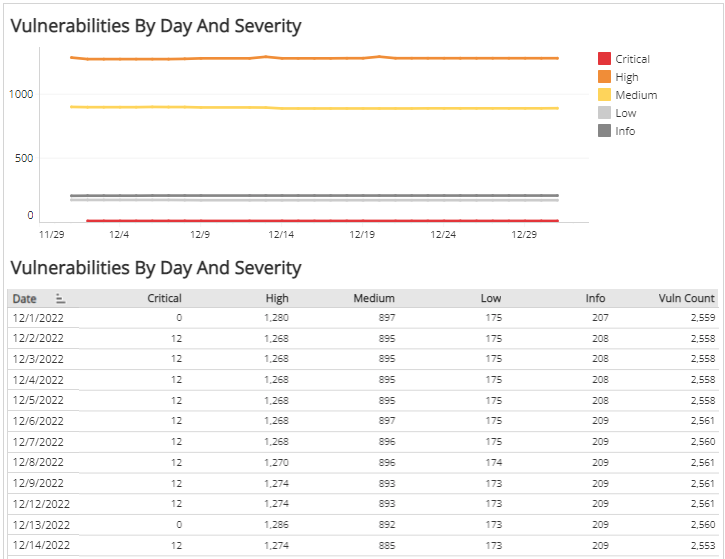
Vulnerabilities by Day and Severity section
This section provides a line graph of the vulnerability count for every CVSS severity category and trend over the selected month, and a list with the vulnerability count in every CVSS severity category on each day for the selected month.