Monthly Security Posture Report
The Monthly Security Posture report provides the current and historic monthly security risk and health posture of your environment, including configuration and security remediations, risk posture overviews, vulnerabilities assessments, and threat analysis.
Use this report to prioritize opportunities to improve your overall security posture and optimize security collection, detection, and response capabilities deployed in your environment.
This report is composed of the following six pages:
- Summary
- Risk Index
- Configuration Remediations
- Security Remediations
- Vulnerabilities
- Threats
To page through the report, go to the next page, click the arrow icon (![]() ) on the top right of the report.
) on the top right of the report.
To access the Monthly Security Posture report:
- In the Alert Logic console, click the menu icon (
 ), and then click
  Validate.
 - Click Reports, and then click Risk.
- Click Security Posture, and then click Monthly Security Posture.
Filter the report
To refine your findings, filter your report by month and customer account name.
Filter the report using drop-down menus
By default, Alert Logic includes (All) values for most filters in the report.
To add or remove filter values:
- Click the drop-down menu in the filter, and then select or clear values.
- Click Apply.
The report allows you to share its data by email, or download the report as an image, data, crosstab, or PDF file.
Schedule the report
After you finish setting up the report, you can use CREATE REPORT to run it periodically and subscribe users or an integration (such as a webhook) to receive a notification when the report is generated. To learn how to schedule the report and subscribe notification recipients, see Scheduled Reports and Notifications.
Summary page
The Summary page provides an overview of the contents analyzed within the pages of this report.
Average Threat Risk Index (TRI) section
This section provides the average TRI score for the previous month and the selected month, and the total change (and the percentage of change) of the TRI score between those two months.

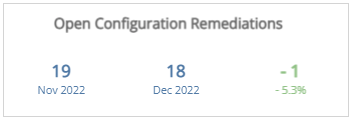
Open Configuration Remediations section
This section provides the total number of open configuration remediations for the previous month and the selected month, and the total change with percentage for open configuration remediations between those two months.
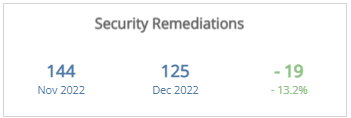
Security Remediations
This section provides the total number of security remediations for the previous month and the selected month, and the total change with percentage for security remediations between those two months.
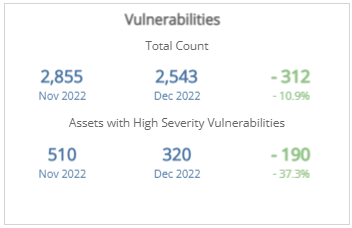
Vulnerabilities section
This section provides the total number of vulnerabilities and assets with high severity vulnerabilities.
Total Count
The top row provides the total number of vulnerabilities for the previous month and the selected month, and the total change (and the percentage of change) for the total number of vulnerabilities between those two months.
Assets with High Severity Vulnerabilities
The bottom row provides the total number of assets with critical and high severity vulnerabilities for the previous month and the selected month, and the total change (and the percentage of change) for those assets between the two months.
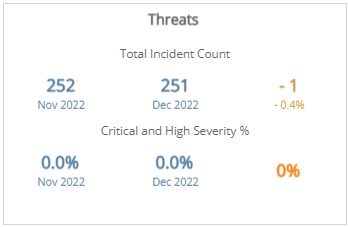
Threats section
This section provides the total number of incidents and the percentages of those incidents in the critical and high severity categories.
Total Incident Count
The top row provides the total number of incidents for the previous month and the selected month, and the total change with percentage for the number of incidents between those two months.
Critical and High Severity Percentage
The bottom row provides the percentages of incidents in the critical and high severity categories for the previous month and the selected month, and the total change (and the percentage of change) for those incidents in the critical and high severity categories between the two months.
Risk Index page
To see the Risk Index page, click the arrow icon (![]() ) on the top right of the Summary page.
) on the top right of the Summary page.
The Risk Index page provides an overview of your TRI score trends by assets.
The Customer Account filter impacts the TRI score and averages displayed in some sections of this page when there are multiple customer accounts. If you filter by all customer accounts, the report displays the Average TRI Score across all customer accounts. If you filter by a single customer account, the report displays the TRI score (not the average) for the selected customer account.
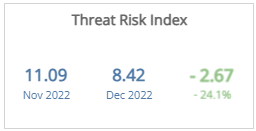
Threat Risk Index section
This section provides the average TRI score for the previous month and the selected month, and the total change (and the percentage of change) for the TRI score between those two months.
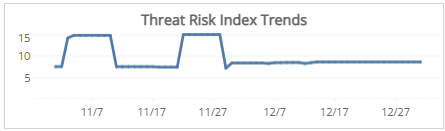
Threat Risk Index Trends section
This section provides the daily TRI score trend of the last 14 days for the selected month.
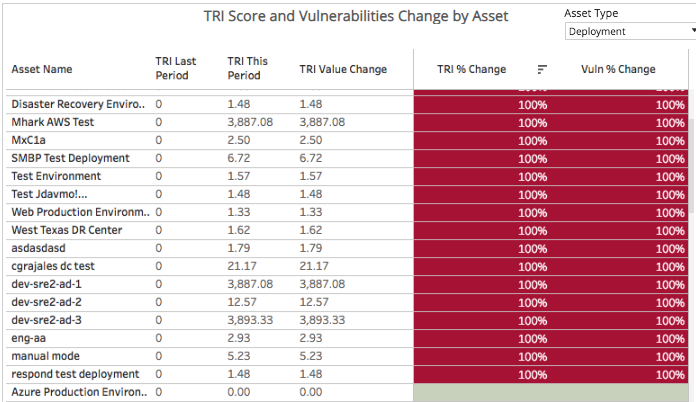
TRI Score and Vulnerabilities Change by Asset section
This section provides the number and percentage changes of TRI scores, by asset type, for the previous month, and the selected month. The color-coded bars represent the percentage change of TRI score change between those two months. The report organizes the list by asset name, previous month, selected month, and the number and percentage change.
To view the TRI score changes from deployments, VPC/networks, or customer accounts, click the Asset Type drop-down menu on the top right of the graph, and then select the asset type you want to see.
Configuration Remediations page
To see the Configuration Remediations page, click the arrow icon (![]() ) on the top right of the Risk Index page.
) on the top right of the Risk Index page.
The Configuration Remediations page provides an overview of the state of configuration remediations and how they are handled in the Remediations page of the Alert Logic console.
Open Configuration Remediations section
This section provides the total number of open configuration remediations for the previous month and the selected month, and the total change (and the percentage of change) of open configuration remediations between those two months.
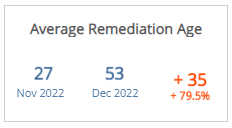
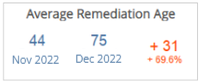
Average Remediation Age section
This section provides the average number of days to add new configuration remediations to your planned remediations for the previous month and the selected month, and the percentage change of the average number of days between those two months.
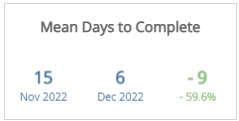
Mean Days to Complete section
This section provides the average number of days to complete the configuration remediations added to your planned remediations for the previous month and the selected month, and the total change (and the percentage of change) of the average number of days to complete those remediations between those two months.
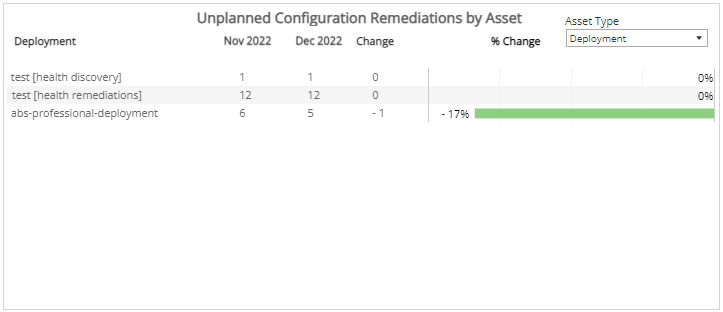
Unplanned Configuration Remediations by Asset section
This section provides the number and percentage changes of configuration remediations, by asset type, that you did not add to your planned remediations for the last month, the selected month, and the total change (and the percentage of change) between those two months. The color-coded bars represent the percentage change of configuration remediations that went unplanned for that asset.
To view the number of unplanned configuration remediations from deployments, VPC/networks, or customer accounts, click the Asset Type drop-down menu on the top right of the graph, and then select the asset type you want to see.
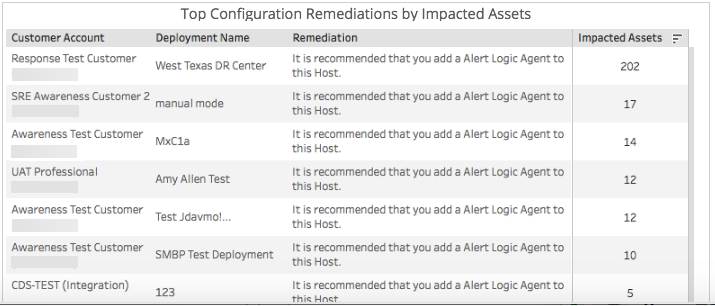
Top Configuration Remediations by Impacted Assets section
This section displays the configuration remediations with the most impacted assets in your environment for the selected month. The list is organized by customer account, deployment name, remediation, and number of impacted assets.
Security Remediations page
To see the Security Remediations page, click the arrow icon (![]() ) on the top right of the Configuration Remediations page.
) on the top right of the Configuration Remediations page.
The Security Remediations page provides an overview of the state of security remediations and how they are handled in the Remediations page of the Alert Logic console.
Security Remediations section
This section provides the total number of open security remediations for the previous month and the selected month, and the total change (and the percentage of change) of open security remediations between those two months.
Average Remediation Age section
This section provides the average number of days to add new security remediations to your planned remediations for the previous month and the selected month, and the (and the percentage of change) of the average days between those two months.
Mean Days to Complete section
This section provides the average number of days to complete the security remediations added to your planned remediations for the previous month and the selected month, and the total change (and the percentage of change) of the average number of days to complete between those two months.
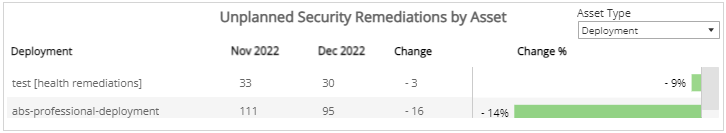
Unplanned Security Remediations by Asset section
This section provides the number and percentage changes of security remediations, by asset type, that you did not add to your planned remediations for the last month, the selected month, and the total change with percentage between those two months. The color-coded bars on the right represents the percentage change of security remediations that went unplanned in that asset.
To view the number of unplanned security remediations from deployments, VPC/networks, or customer accounts, click the Asset Type drop-down menu on the top right of the graph, and then select the asset type you want to see.
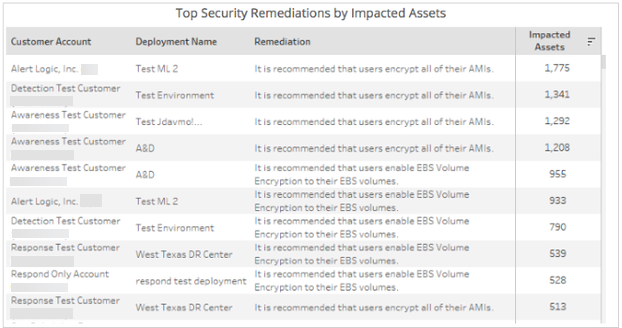
Top Security Remediations by Impact Assets section
This section displays the security remediations with the most impacted assets in your environment for the selected month. The list is organized by customer account, deployment name, remediation, and number of impacted assets.
Vulnerabilities page
To see the Vulnerabilities page, click the arrow icon (![]() ) on the top right of the Security Remediations page.
) on the top right of the Security Remediations page.
The Vulnerabilities page provides an overview of vulnerabilities found across your environment.
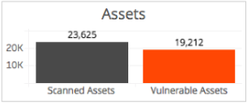
Assets section
This section provides a bar graph that displays the number of scanned assets and the number of vulnerable assets found in the selected month.
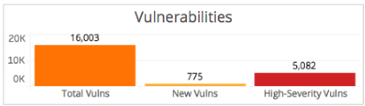
Vulnerabilities section
This section provides a bar graph that displays the total number of vulnerabilities found, the number of vulnerabilities seen for the first time, and the number of vulnerabilities in the critical and high severity categories in the selected month.
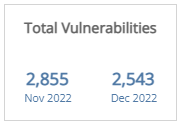
Total Vulnerabilities section
This section provides the total number of vulnerabilities found in the previous and the selected month.
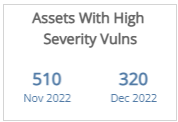
Assets with High Severity Vulnerabilities section
This section provides the number of assets with vulnerabilities in the high severity category in the previous month and the selected month.
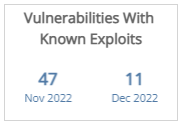
Vulnerabilities with Known Exploits section
This section provides the number of vulnerabilities with known exploit code available in the previous month and the selected month.
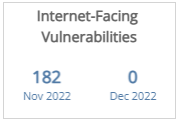
Internet-Facing Vulnerabilities section
This section provides the number of vulnerabilities found in external scans in the previous month and the selected month.
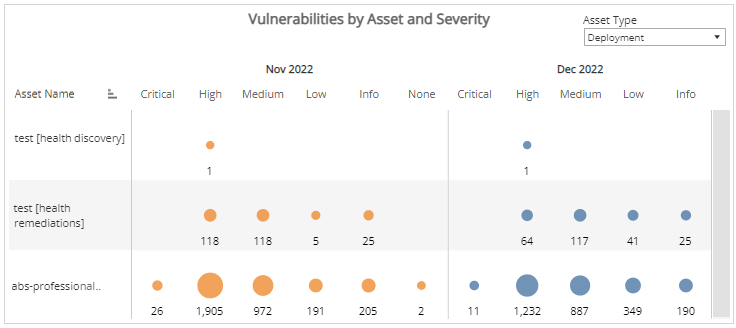
Vulnerabilities by Asset and Severity section
This section presents the distribution of assets and vulnerability severity categories in the previous and selected months displayed as color-coded circles.
Alert Logic assigns
| Severity rating | CVSS v2 score range | CVSS v3 score range |
|---|---|---|
|
|
Not applicable | 9.0 - 10.0 |
|
|
7.0 - 10.0 | 7.0 - 8.9 |
|
|
4.0 - 6.9 | 4.0 - 6.9 |
|
|
0.1 - 3.9 | 0.1 - 3.9 |
|
|
0.0 | 0.0 |
Some vulnerabilities in the National Vulnerability Database have both CVSS v2 and CVSS v3 scores. Alert Logic displays the newer CVSS v3 score and severity rating in prominent locations and both scores in detail views. If only one CVSS score exists, Alert Logic uses that score and severity rating.
The size of the circles represents the total vulnerabilities in each severity category, while the color in this section represents the month. To see more information on a specific set of vulnerabilities, hover over a circle.
To view the distribution of assets and severity categories of vulnerabilities from deployments, VPC/networks, or customer accounts, click the Asset Type drop-down menu on the top right of the graph, and then select the asset type you want to see.
Threats page
To see the Threats page, click the arrow icon (![]() ) on the top right of the Vulnerabilities page.
) on the top right of the Vulnerabilities page.
The Threats page provides an overview of threats found across your environment.
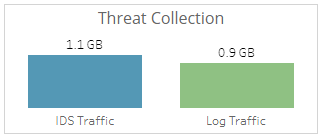
Threat Collection section
This section provides a color-coded bar graph that displays IDS traffic, log and WAF traffic in the selected month.
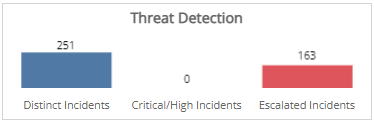
Threat Detection section
This section provides a graph that displays the total of distinct incidents, incidents in the critical or high threat level categories, and incidents that were escalated in the selected month.
Total Incidents section
This section provides the total number of incidents in the previous and selected month.

Critical and High Incidents section
This section provides the number of incidents in the critical or high threat level categories for the previous and selected months.
Assets with Critical or High Incidents section
This section provides the number of assets with incidents in the critical or high threat level categories for the previous and selected months.
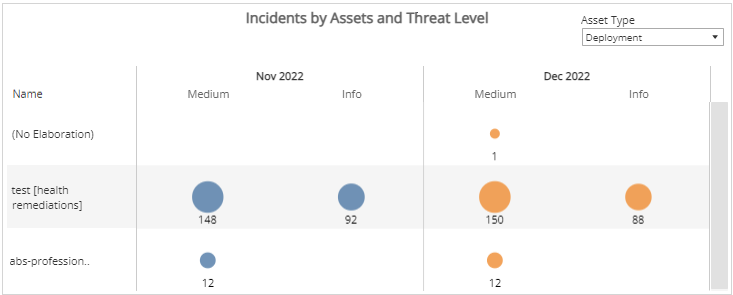
Incidents by Assets and Threat Level section
This section displays the distribution of assets and threat level categories of incidents for the previous and selected months presented in color-coded circles. The size of the circles represents the number of incidents in each threat level category while the color represents the month.
The threat levels are the following:
- Critical: May represent a successful breach
- High: Requires immediate attention
- Medium: Requires closer observation and monitoring
- Low: Common events
To see more information on a specific set of incidents, hover over a circle.
To view the distribution of assets and severity categories of incidents from deployments, VPC/networks, or customer accounts, click the Asset Type drop-down menu on the top right of the graph, and then select the asset type you want to see.