Log Collection
The Log Collection report provides visibility into log collection volume and log messages processed in your environment, including log collection per day and a list of collectors with volume by GB, EPS or log messages. Use this report to support log collection configuration and optimization efforts in your environment.
To access the Log Collection report:
- In the Alert Logic console, click the menu icon (
 ), and then click
  Validate.
 - Click Reports, and then click Service.
- Under Capability Usage, click VIEW.
- Click Log Collection.
Filter the report
To refine your findings, filter your report by Date Range, Customer Account, and Deployment Name.
Filter the report using drop-down menus
By default, Alert Logic includes (All) values for most filters in the report.
To add or remove filter values:
- Click the drop-down menu in the filter, and then select or clear values.
- Click Apply.
Schedule the report
After you finish setting up the report, you can use CREATE REPORT to run it periodically and subscribe users or an integration (such as a webhook) to receive a notification when the report is generated. To learn how to schedule the report and subscribe notification recipients, see Scheduled Reports and Notifications.
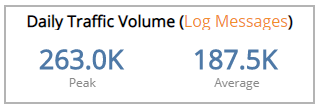
Daily Traffic Volume section
This section provides the peak daily volume and average daily volume of collected log messages during the selected period.
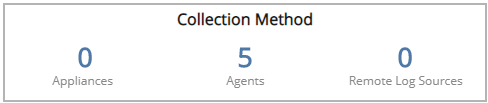
Collection Method section
This section provides the total count of collectors that received log data for each collection method (appliances, agents, and remote log sources) in the selected period.
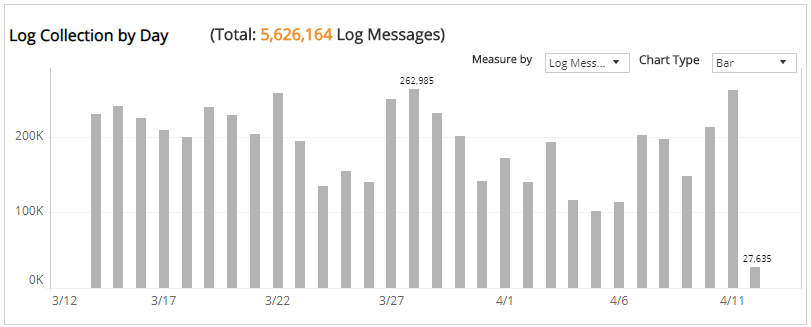
Log Collection by Day section
The bar graph displays the daily log collection for the selected filters. You can display the data as a line or bar chart. Click the Chart Type drop-down on the top right of the graph, and then select the chart type you want to see. You can also view the data measured by events per second (EPS), gigabytes (GB), or log messages. Click the Measure by drop-down, and then select how you want the data measured.
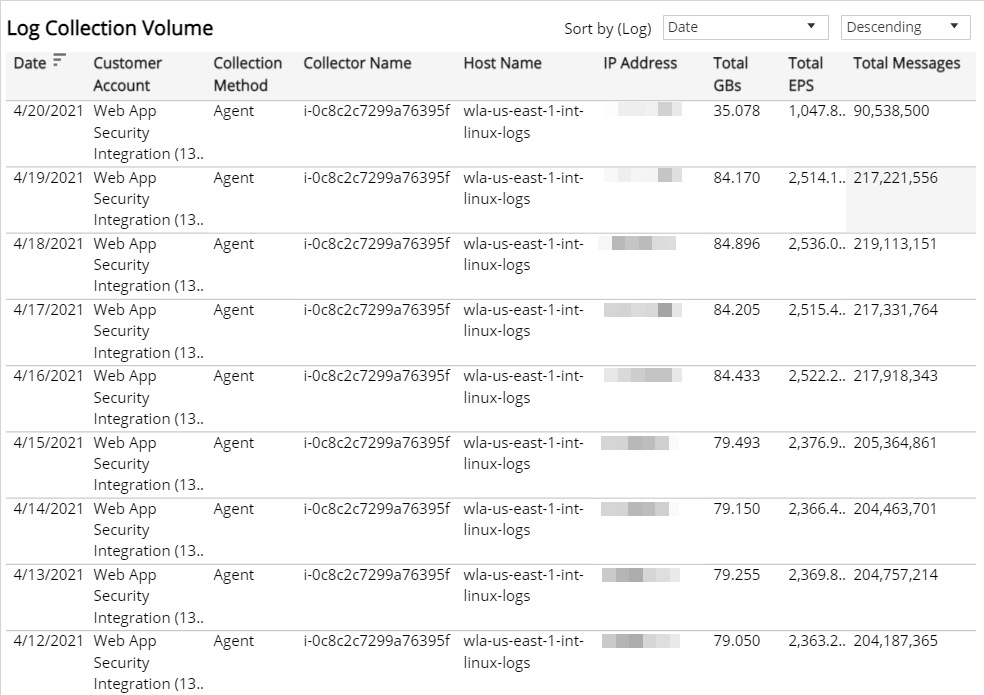
Log Collection Volume section
The list displays the daily log collection volume by collector, GB, EPS, and messages processed in your environment for the selected period. The list is organized by date, customer account, collector method, collector name, host name, IP address, total GB, total EPS, and total messages.