Daily Health Summary
The Daily Health Summary report provides insight into the daily issues in your environment related to your protected network health status, data collection and network IDS traffic, and hosts missing agents. This report is composed of three sections: Network Health Status, Collection Issues, and Missing Agent. Use this report to improve network protection, fix configuration issues, and support optimization efforts in your environment.
To access the Daily Health Summary report:
- In the Alert Logic console, click the menu icon (
 ), and then click
  Validate.
 - Click Reports, and then click Service.
- Under Health, click VIEW
- Click Daily Health Summary.
Filter the report
To refine your findings, filter your report by customer account, deployment name, and day.
Filter the report using drop-down menus
By default, Alert Logic includes (All) values for most filters in the report.
To add or remove filter values:
- Click the drop-down menu in the filter, and then select or clear values.
- Click Apply.
Schedule the report
After you finish setting up the report, you can use CREATE REPORT to run it periodically and subscribe users or an integration (such as a webhook) to receive a notification when the report is generated. To learn how to schedule the report and subscribe notification recipients, see Scheduled Reports and Notifications.
Network Health Status
The Network Health Status section provides the daily counts and percentage changes of your network statuses, and the top networks impacted by open configuration remediations.
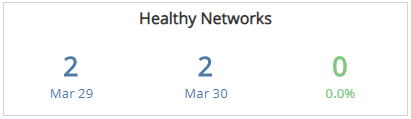
Healthy Networks section
This section provides the total count of networks in healthy statuses for the previous day and the selected day, and the total change with the percentage change between the two days.
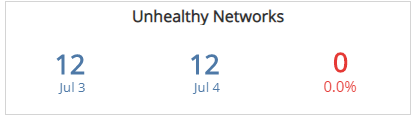
Unhealthy Networks section
This section provides the total count of networks in unhealthy statuses for the previous day and the selected day, and the total change with the percentage change between the two days.
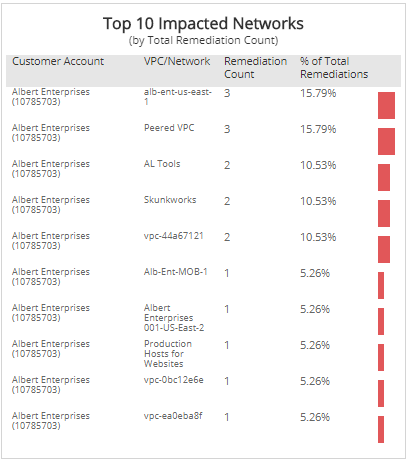
Top 10 Impacted Networks section
The list displays the networks with the most open configuration remediations for the selected day. The list is organized by customer account, deployment name, VPC or network name, remediation count, and the percentage of the total remediations, along with a percentage bar.
Collection Issues
The Collection Issues section provides the daily counts and percentage changes of your appliances and agents, and top lists of impacted agents, appliances, and deployments with the most missing open configuration remediations.
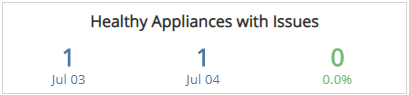
Healthy Appliances with Issues section
This section provides the total count of appliances with issues in healthy statuses for the previous day and the selected day, and the total change with the percentage change between the two days.
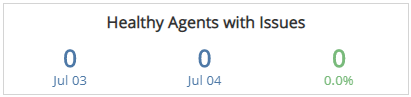
Healthy Agents with Issues section
This section provides the total count of agents with issues in healthy statuses for the previous day and the selected day, and the total change with the percentage change between the two days.
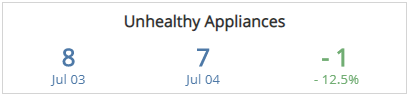
Unhealthy Appliances section
This section provides the total count of appliances in unhealthy statuses for the previous day and the selected day, and the total change with the percentage change between the two days.
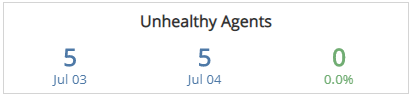
Unhealthy Agents section
This section provides the total count of agents in unhealthy statuses for the previous day and the selected day, and the total change with the percentage change between the two days.
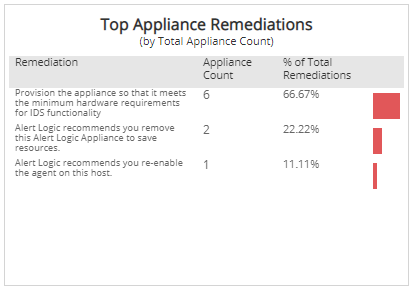
Top Appliance Remediations section
The list displays the open configuration remediations impacting collection on the most appliances on the selected day. The list is organized by the remediation summary, appliance count, and the percentage of the total remediations, along with a percentage bar.
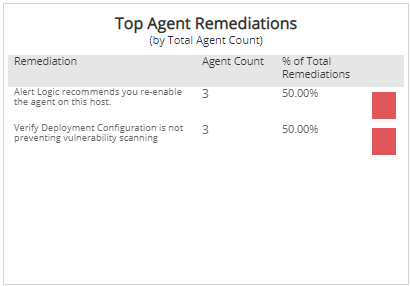
Top Agent Remediations section
The list displays the open configuration remediations impacting the most agents on the selected day. The list is organized by the remediation summary, agent count, and the percentage of the total remediations, along with a percentage bar.
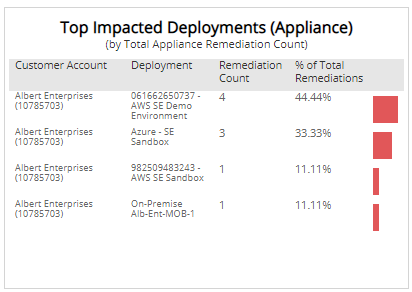
Top Impacted Deployments (Appliance) section
The list displays the deployments with appliances with the most open configuration remediations on the selected day. The list is organized by customer account, deployment name, remediation count, and the percentage of the total remediations, along with a percentage bar.
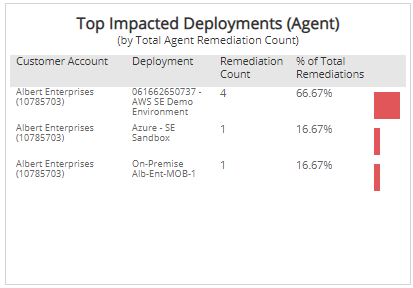
Top Impacted Deployments (Agent) section
The list displays the deployments with agents with the most open configuration remediations on the selected day. The list is organized by customer account, deployment name, remediation count, and the percentage of the total remediations, along with a percentage bar.
Missing Agent
The Missing Agent section provides the daily statuses, count and percentage changes of missing agents, and top lists of impacted deployments, platform, and hosts that are missing agents.
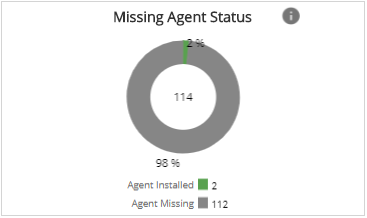
Missing Agent Status section
This section provides a color-coded donut chart with the daily total host count, and the counts and percentages for hosts with agents installed and for hosts with agents missing for the selected day.
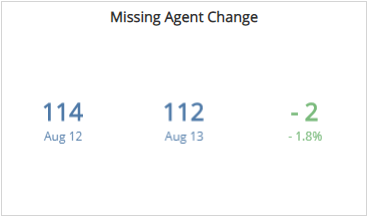
Missing Agent Change section
This section provides the count of missing agent change for the previous day and the selected day, and the total change with the percentage change between the two days.
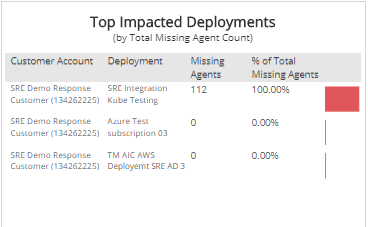
Top Impacted Deployments section
This section displays the top ten impacted deployments with the most hosts missing agents on the selected day. The section lists the customer account, deployment name, missing agent counts, and percentages of total missing agents, along with a percentage bar, for the selected day.
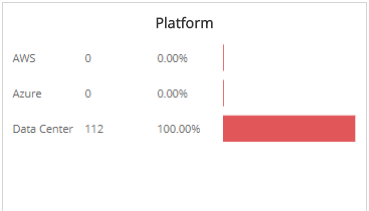
Platforms section
The section lists the platform, missing agent counts, and percentages of total missing agents, along with a percentage bar, for the selected day.
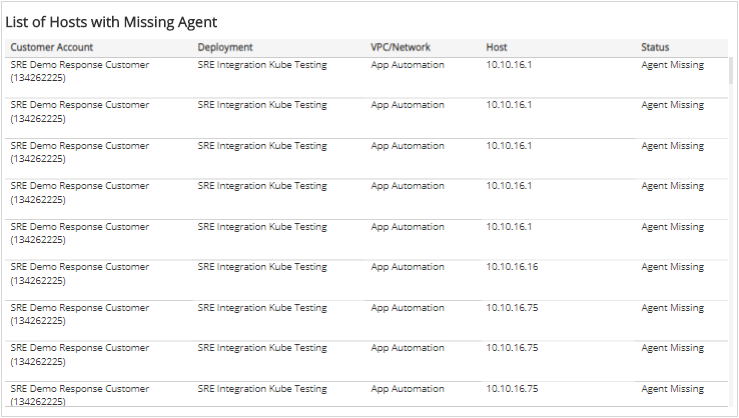
List of Hosts with Missing Agent section
This list displays the hosts with the missing agents for the selected day. The list is organized by customer account, deployment name, VPC or network name, host, and status.