AWS Targeted Deployment Trends
The AWS Targeted Deployment Trends report provides a bar and histogram chart that allows you to review trends in Amazon GuardDuty and Network IDS incidents for a date range by Amazon Web Services (AWS) account ID, region, VPC, container image, subnet and Security Group.
For more information about incidents, see Incidents.
To access the AWS Targeted Deployment Trends Report:
- In the Alert Logic console, click the menu icon (
 ), and then click
  Validate.
 - Click Reports, and then click Threats.
- Under AWS Incident Analysis, click VIEW.
- Click AWS Targeted Deployment Trends.
Filter the report
To refine your findings, you can filter your report by Date Range, Customer Account, Detection Source, Deployment Name, Top Tags, Threat Level, Classification,and Incident Type.
Filter the report using drop-down menus
By default, Alert Logic includes (All) values for most filters in the report.
To add or remove filter values:
- Click the drop-down menu in the filter, and then select or clear values.
- Click Apply.
Filter the report using visuals
To refine your findings, click an item within a visual. To filter by multiple items, hold down Ctrl or Command, and then click each item in a visual that you want to use to apply a filter. You can filter using visuals and items selected in different sections. Click on an item again to remove a filter.
Schedule the report
After you finish setting up the report, you can use CREATE REPORT to run it periodically and subscribe users or an integration (such as a webhook) to receive a notification when the report is generated. To learn how to schedule the report and subscribe notification recipients, see Scheduled Reports and Notifications.
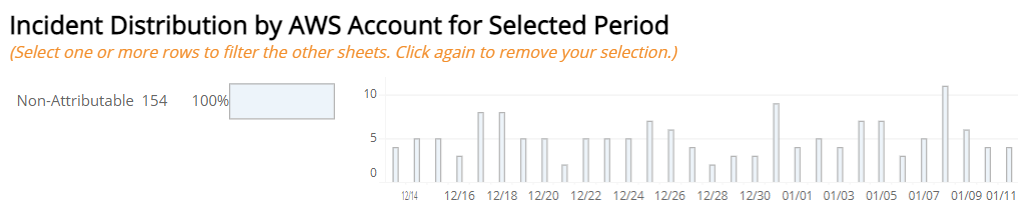
Incident Distribution by AWS Account for Selected Period
This section provides a bar and histogram chart of incidents by AWS account for the selected date range. The bar chart displays the name, count, and proportion of incidents for each AWS account. The histogram displays incident count trends by AWS account.
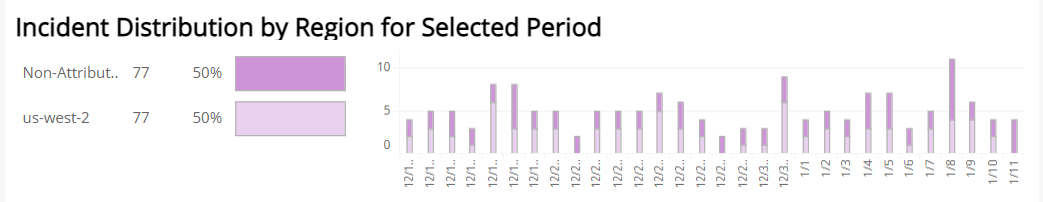
Incident Distribution by Region for Selected Period
This section provides a bar and histogram chart of incidents by region for the selected date range. The bar chart displays the name, count, and proportion of incidents for each region. The histogram displays incident count trends by region.
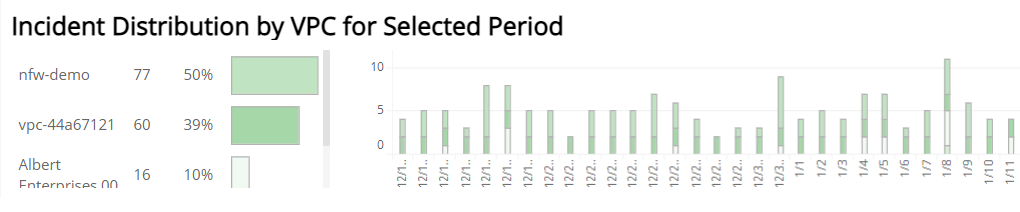
Incident Distribution by VPC for Selected Period
This section provides a bar and histogram chart of incidents by VPC for the selected date range. The bar chart displays the name, count, and proportion of incidents for each VPC. The histogram displays incident count trends by VPC.
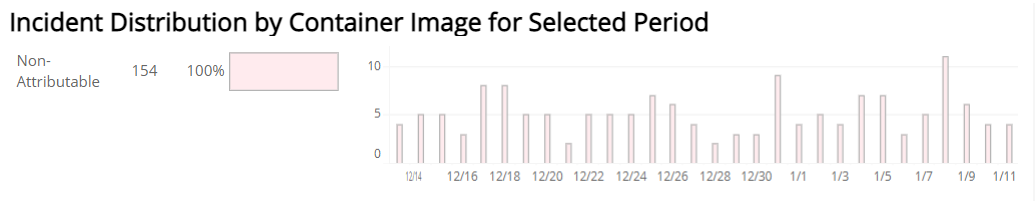
Incident Distribution by Container Image for Selected Period
This section provides a bar and histogram chart of incidents by container image for the selected date range. The bar chart displays the name, count, and proportion of incidents for each container image. The histogram displays incident count trends by Container Image.
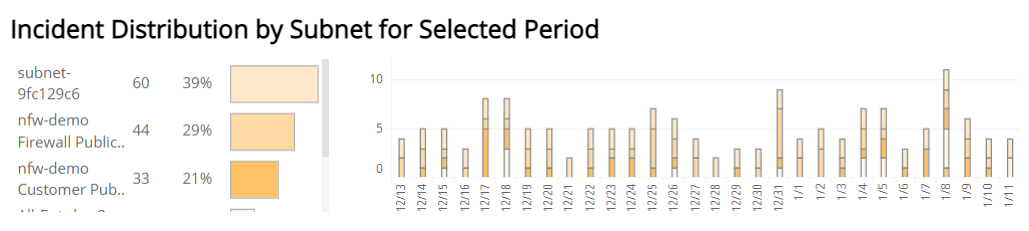
Incident Distribution by Subnet for Selected Period
This section provides a bar and histogram chart of incidents by subnet for the selected date range. The bar chart displays the name, count, and proportion of incidents for each subnet. The histogram displays incident count trends by subnet.
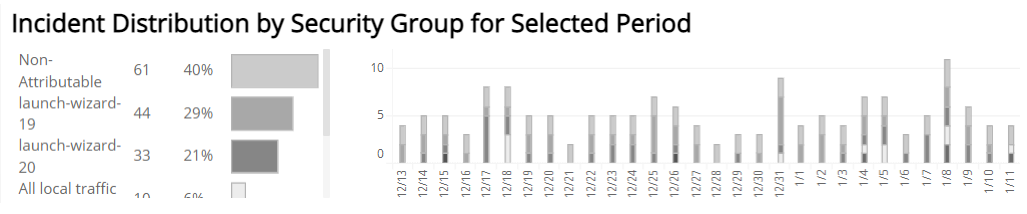
Incident Distribution by Security Group for Selected Period
This section provides a bar and histogram chart of incidents by Security Group for the selected date range. The bar chart displays the name, count, and proportion of incidents for each Security Group. The histogram displays incident count trends by Security Group.