Weekly Incident Account Summary
The Weekly Incident Summary report provides the current distribution and trending data for incidents detected across your customer accounts or deployments. Use the report to evaluate accounts or deployments by top incident count, threat level, count by week and threat level, detection source, escalation status, MITRE classification, top attackers, and top targets.
To access the Weekly Incident Account Summary report:
- In the Alert Logic console, click the menu icon (
 ), and then click
  Validate.
 - Click Reports, and then click Threats.
- Under Incident Account Summary, click VIEW.
- Click Weekly Incident Account Summary.
Filter the report
To refine your findings, filter your report by Select Week(s), Customer Account, Deployment Name, Detection Source, Threat Level, Status, and Escalation Status.
Filter the report using drop-down menus
By default, Alert Logic includes (All) values for most filters in the report.
To add or remove filter values:
- Click the drop-down menu in the filter, and then select or clear values.
- Click Apply.
Filter the report using visuals
To refine your findings, click an item within a visual. To filter by multiple items, hold down Ctrl or Command, and then click each item in a visual that you want to use to apply a filter. You can filter using visuals and items selected in different sections. Click on an item again to remove a filter.
Schedule the report
After you finish setting up the report, you can use CREATE REPORT to run it periodically and subscribe users or an integration (such as a webhook) to receive a notification when the report is generated. To learn how to schedule the report and subscribe notification recipients, see Scheduled Reports and Notifications.
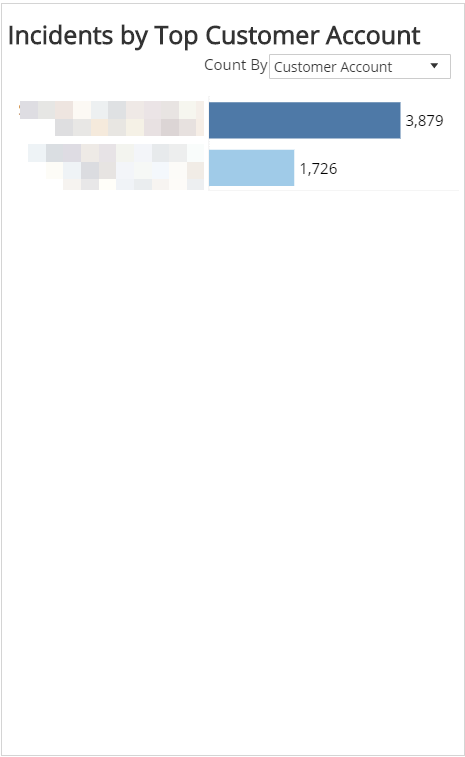
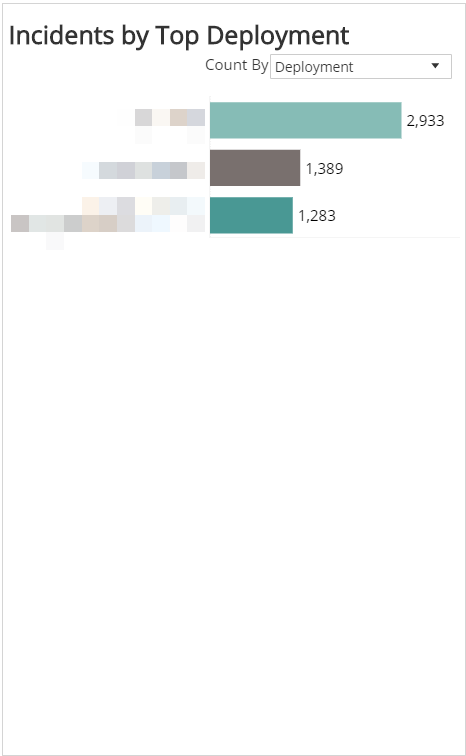
Incidents by Top Customer Account or Deployment section
This section provides the total count of incidents by customer account or deployment for the selected week(s). Your default view is the count of incidents by customer account. Use the Count By drop-down list to see the count of incidents by deployment.
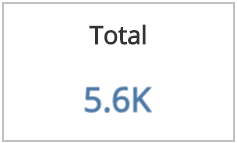
Total Incidents section
This section provides the total incident count for the selected week(s).
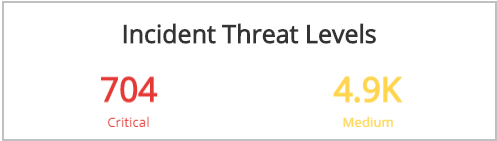
Incident Threat Levels section
This section provides the total count of incidents by threat level for the selected week(s).
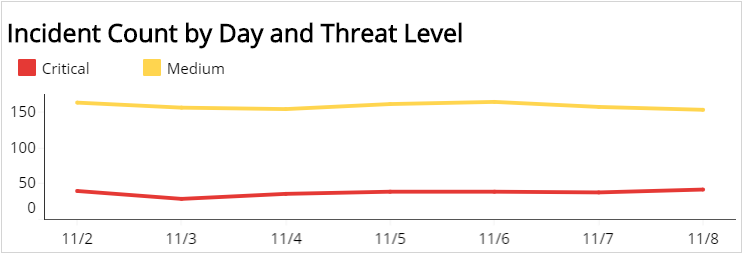
Incident Count by Day and Threat Level section
This section provides the daily count of incidents and threat level as a line graph to visualize trends for the selected week(s).
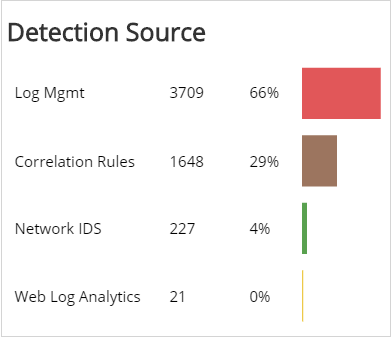
Detection Source section
This section provides the count and percentages for incidents by detection source for the selected week(s).
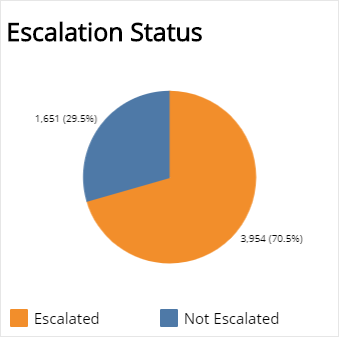
Escalation Status section
This section provides the count and percentages for incidents by escalation status for the selected week(s).
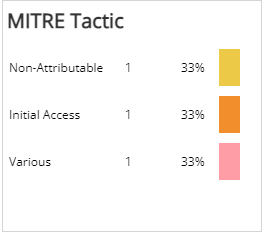
MITRE Tactic section
This section provides the count and percentages for each incident by MITRE Tactic in a color-coded bar graph for the selected week.
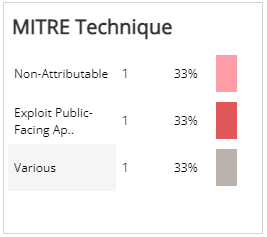
MITRE Technique section
This section provides the count and percentages for each incident by MITRE Technique in a color-coded bar graph for the selected week.
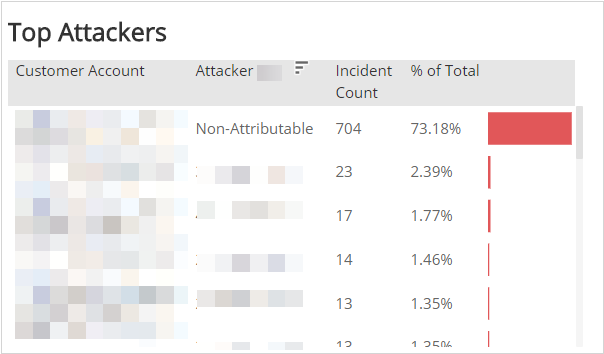
Top Attackers section
This section lists the top attackers for the selected week(s) and includes detailed information about Customer Account, Attacker, and incident counts and percentages.
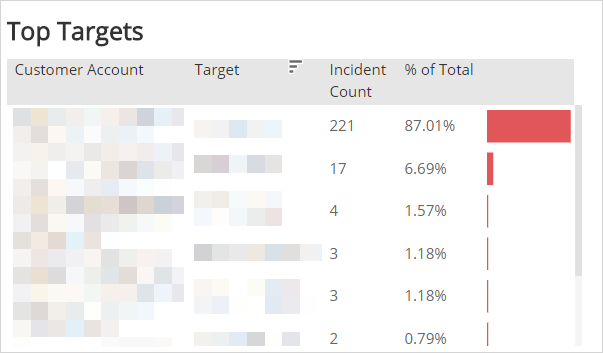
Top Targets section
This section lists the top targets for the selected week(s) and includes detailed information about Customer Account, Target, and incident counts and percentages.