Incident Distribution Explorer
The Incident Distribution Explorer report presents incident trends by detection source, status, threat level, and MITRE classification for the selected date range. The report presents the information in pie graphs and a series of histograms in each category for the selected date range.
For more information about incidents, see Incidents.
To access the Incident Distribution Explorer report:
- In the Alert Logic console, click the menu icon (
 ), and then click
  Validate.
 - Click Reports, and then click Threats.
- Under Incident Analysis, click VIEW.
- Click Incident Distribution Explorer.
Filter the report
To refine your findings, filter your report by Date Range, Customer Account, Deployment Name, Detection Source, Status, and Escalation Status.
Filter the report using drop-down menus
By default, Alert Logic includes (All) values for most filters in the report.
To add or remove filter values:
- Click the drop-down menu in the filter, and then select or clear values.
- Click Apply.
Filter the report using visuals
To refine your findings, click an item within a visual. To filter by multiple items, hold down Ctrl or Command, and then click each item in a visual that you want to use to apply a filter. You can filter using visuals and items selected in different sections. Click on an item again to remove a filter.
Schedule the report
After you finish setting up the report, you can use CREATE REPORT to run it periodically and subscribe users or an integration (such as a webhook) to receive a notification when the report is generated. To learn how to schedule the report and subscribe notification recipients, see Scheduled Reports and Notifications.
Total Incidents section
This section provides the total incident count for the selected filters and date range.

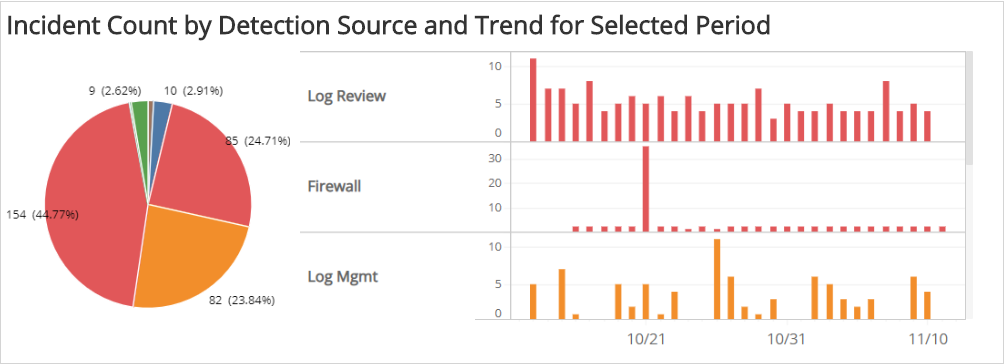
Incident Count by Detection Source and Trend for Selected Period section
The section provides the distribution of incidents by detection source for the selected date range. The pie chart presents the count and percentages for the detection source category. The histogram presents the daily trend of incident counts by detection source. If you have multiple detection sources, you can use the scroll bar to the right of the histogram to view more detection sources.
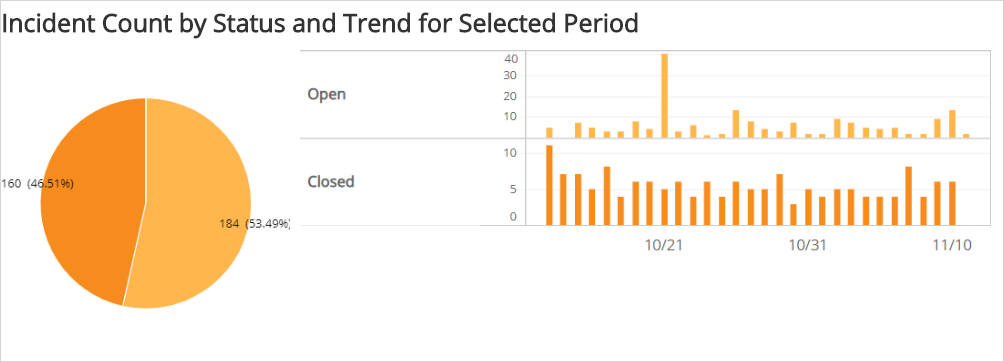
Incident Count by Status and Trend for Selected Period section
This section provides the distribution of incidents by status for the selected date range. The pie chart presents the count and percentages in the status category. The histogram presents the daily trend of incident counts by status.
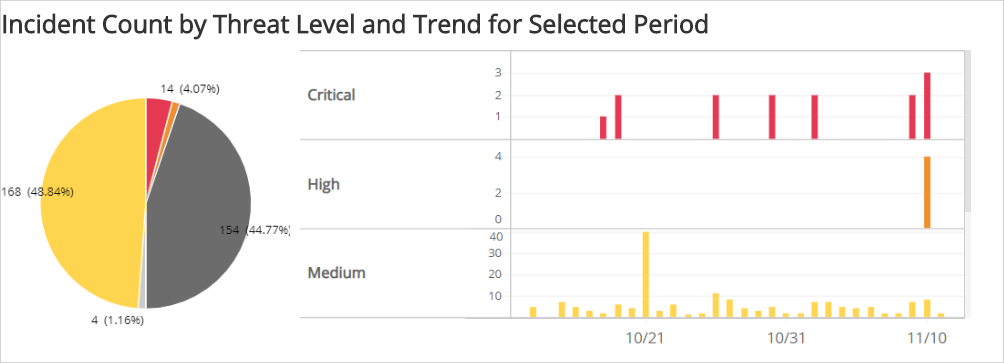
Incident Count by Threat Level and Trend for Selected Period section
This section provides the distribution of incidents by threat level for the selected date range.
Incident threat levels convey the severity of each incident raised for protected assets, which allows you to assess and prioritize the actions to take toward threat remediation. Alert Logic categorizes incidents with the following icons and colors:
-
 Critical
 -
 High
High -
 Medium
 -
 Low
Low -
 Info
Info
The pie chart presents the count and percentages for the threat level category. The histogram presents the trend in daily incident counts by threat level. Use the scroll bar to the right of the histogram to view additional data.
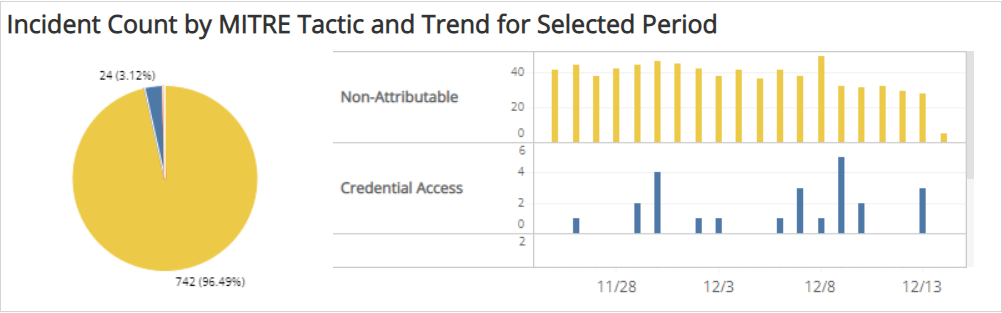
Incident Count by MITRE Tactic and Trend for Selected Period section
The section provides the distribution of incidents by MITRE Tactic for the selected date range. The pie chart presents the count and percentages by MITRE Tactic. The histogram presents the daily trend of incident counts by MITRE Tactic. Use the scroll bar to the right of the histogram to view additional data.
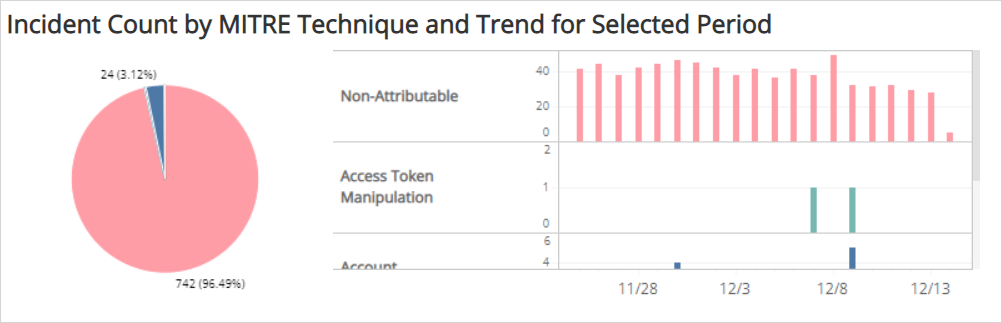
Incident Count by MITRE Technique and Trend for Select Period section
The section provides the distribution of incidents by MITRE Technique for the selected date range. The pie chart presents the count and percentages by MITRE Technique. The histogram presents the daily trend of incident counts by MITRE Technique. Use the scroll bar to the right of the histogram to view additional data.