Coverage and Health Dashboard
The Coverage and Health dashboard provides insight into statuses in your environment and your entitlement usage. Use this dashboard to improve network protection, fix configuration issues, and support optimization efforts in your environment. This dashboard includes visuals of the following data:
- Network and collection statuses
- Open configuration exposures
- Unprotected node count
The Coverage and Health dashboard is part of the Dashboards feature. For more information about Dashboards, see Dashboards.
Access the Coverage and Health dashboard
To access the Coverage and Health dashboard, in the Alert Logic console, click the menu icon (![]() ), and then click
), and then click ![]() Dashboards. Click the drop-down menu on the top left to see the list of available dashboards, and then click Coverage and Health.
Dashboards. Click the drop-down menu on the top left to see the list of available dashboards, and then click Coverage and Health.
Coverage and Health visuals
If available, you can click CONFIGURE or INVESTIGATE in the visuals to be redirected to the corresponding page in the Alert Logic console and take further action if necessary. You can hover over an item in a visual to see a detailed level and a tooltip. Click an item to be redirected to the corresponding page in the Alert Logic console with the data already filtered for you.
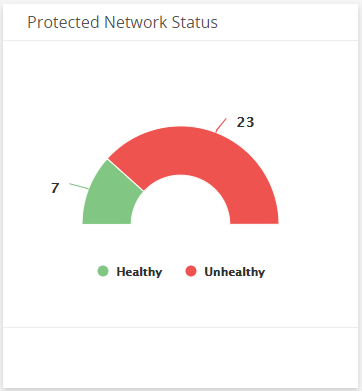
Protected Network Status
This visual provides the counts for networks that are healthy and unhealthy, indicating whether the network has significant issues that Alert Logic identified. Click an item in the visual to see specific data related to that status in the Health page.
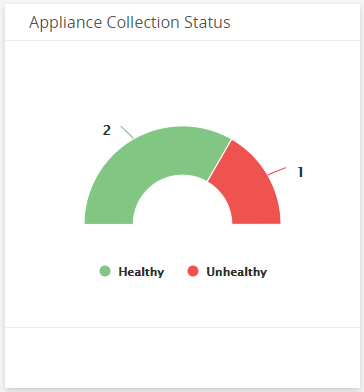
Appliance Collection Status
This visual provides the counts of appliance collections that are healthy and unhealthy, indicating whether the appliance collection has significant issues that Alert Logic identified. Click an item in the visual to see specific data related to that status in the Health page.
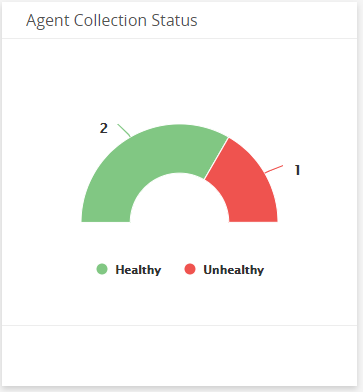
Agent Collection Status
This visual provides the counts of agent collections that are healthy and unhealthy, indicating whether the collection has significant issues that Alert Logic identified. Click an item in the visual to see specific data related to that status in the Health page.
Collector Collection Status
This visual provides the counts of Application Registry collectors that are healthy and unhealthy, indicating whether the collection has significant issues that Alert Logic identified. Click an item in the visual to see specific data related to that status in the Health page.

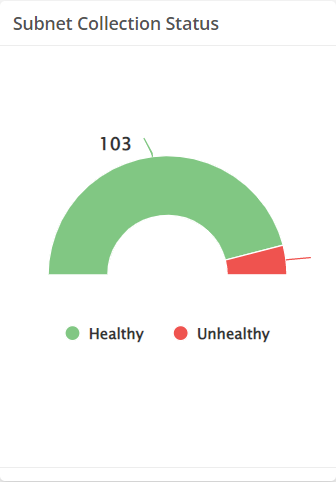
Subnet Collection Status
This visual provides the counts of collector subnets that are healthy and unhealthy, indicating whether the collection has significant issues that Alert Logic identified. Click an item in the visual to see specific data related to that status in the Health page.
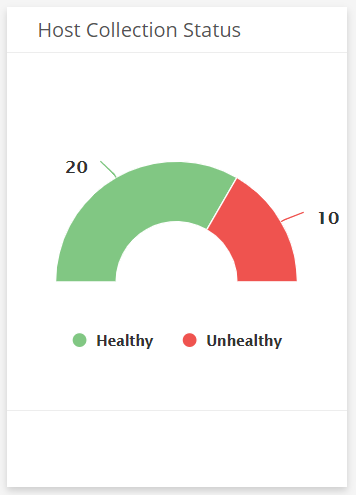
Host Collection Status
This visual provides the counts of collector hosts that are healthy and unhealthy, indicating whether the collection has significant issues that Alert Logic identified. Click an item in the visual to see specific data related to that status in the Health page.
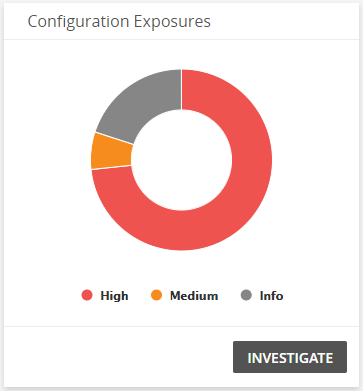
Configuration Exposures
This visual provides the count of open configuration exposures in each threat level. Click INVESTIGATE to be redirected to the Health page to see more information on the exposures in the visual, or click an item to see data specific to that exposure in the Health page.
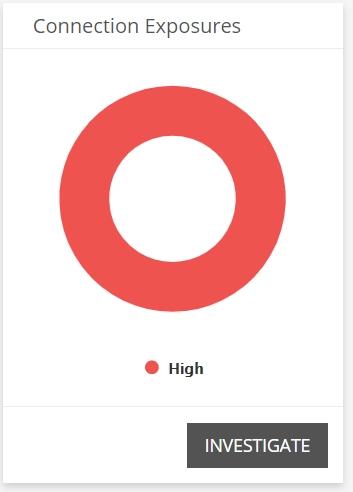
Connection Exposures
This visual provides the count of open connection exposures in each threat level. Click INVESTIGATE to be redirected to the Health page to see more information on the exposures in the visual, or click an item to see data specific to that exposure in the Health page.
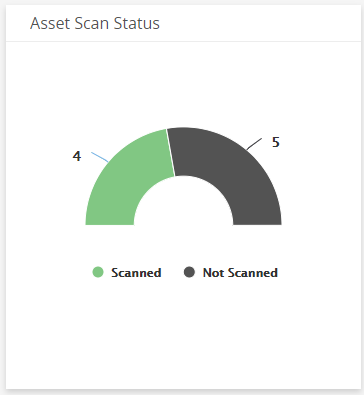
Asset Scan Status
This visual provides the status of scanned assets in your environment.
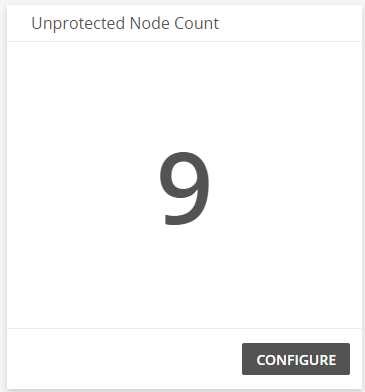
Unprotected Node Count
This visual provides the count of nodes that Alert Logic discovered in your environment that do not have a protection level selected. To configure the protection level of your networks, click CONFIGURE. You will be redirected to the Deployments page.