PCI Requirement 10.6 (Incidents)
The PCI Requirement 10.6 (Incidents) report shows log review and log management incidents to help demonstrate compliance to Requirement 10.6 of PCI DSS.
This report is composed of three pages, Summary page, Log Review Incidents page, and the Log Management Incidents page. Click the Log Review Incidents icon ( ) to see the Log Review Incidents page. Click the Log Management Incident icon (
 ) to see the Log Management Incidents page. Click the arrow icons (
![]() ,
,![]() ) on top of the Log Review Incidents page or Log Management Incidents page to move through the pages in the report.
) on top of the Log Review Incidents page or Log Management Incidents page to move through the pages in the report.
To access the PCI Requirement 10.6 (Incidents) report:
- In the Alert Logic console, click the menu icon (
 ), and then click
  Validate.
 - Click Reports, and then click Compliance.
- Click PCI Audit, and then click PCI Requirement 10.6 (Incidents).
Filter the report
To refine your findings, you can filter your report by customer account and date range.
Filter the report using drop-down menus
By default, Alert Logic includes (All) values for most filters in the report.
To add or remove filter values:
- Click the drop-down menu in the filter, and then select or clear values.
- Click Apply.
Schedule the report
After you finish setting up the report, you can use CREATE REPORT to run it periodically and subscribe users or an integration (such as a webhook) to receive a notification when the report is generated. To learn how to schedule the report and subscribe notification recipients, see Scheduled Reports and Notifications.
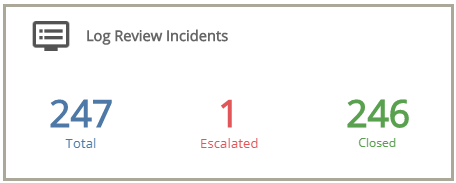
Log Review Incidents section
This section provides the total number of log review incidents found, the status count of log review incidents that the Alert Logic Security Operations Center (SOC) escalated and closed for the selected period.
Click the Log Review incidents icon () to be redirected to the Log Review Incidents page, which contains more information about the incidents during the selected period.
Log Review Incidents page
The Log Review Incidents page provides the count and percentage of total incidents of each status, a daily histogram chart, and a summary of log review incidents for the selected period.
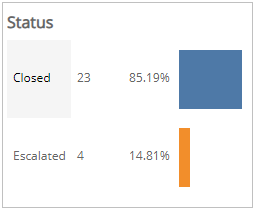
Status section
This section provides the status counts and percentages of total incidents that the Alert Logic Security Operations Center (SOC) analysts closed and escalated for the selected period.
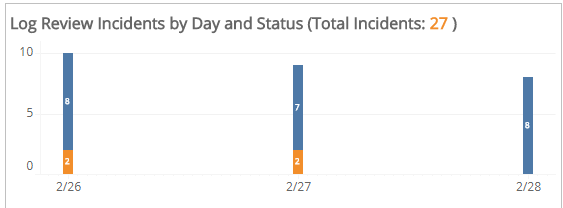
Log Review Incidents by Day and Status section
This section provides a stacked histogram chart that displays the daily status counts of total incidents that the SOC analysts closed and escalated for the selected period.
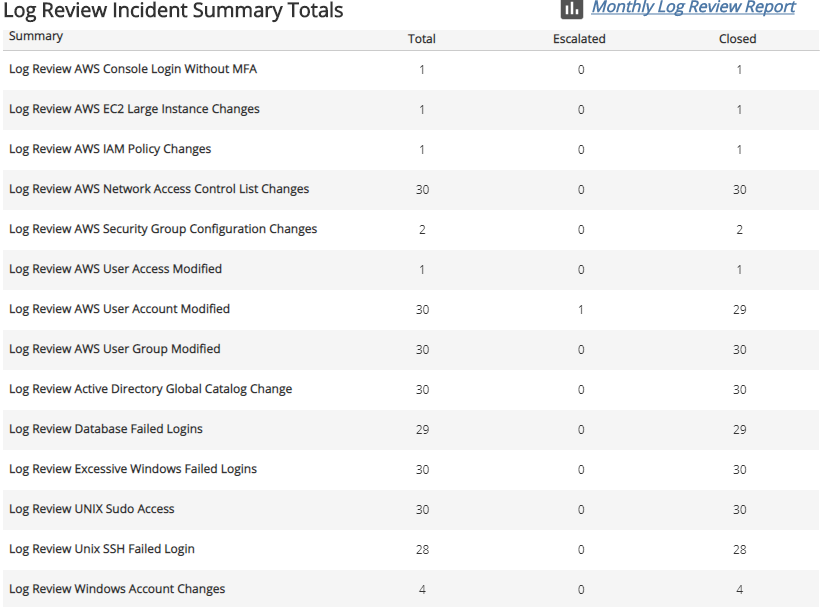
Log Review Incidents Summary Total section
This section displays the total, escalated, and closed incident counts for each type of log review summary category for the selected period.
For more information about the incidents during the selected period, click the Monthly Log Review Report to be redirected to the Monthly Log Review report. To learn more about the Monthly Log Review report, see Monthly Log Review Report.
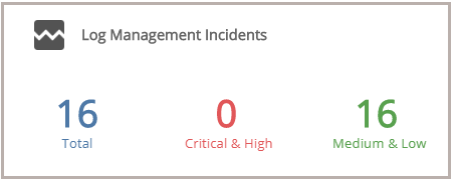
Log Management Incidents section
This section provides the total number of log management incidents created, the number of those log management incidents in critical and high threat levels, and the number of those log management incidents in the medium and low threat levels for the selected period.
Click the Log Management Incidents icon () to be redirected to the Log Management Incidents page page, which contains more information about the incidents for the selected period.
Log Management Incidents page
The Log Management Incidents page provides the daily incident count, the incident count and percentages in each threat level, the incident count and percentages in each classification, the incident count and percentages in each incident type, and a list of incidents for the selected filters.
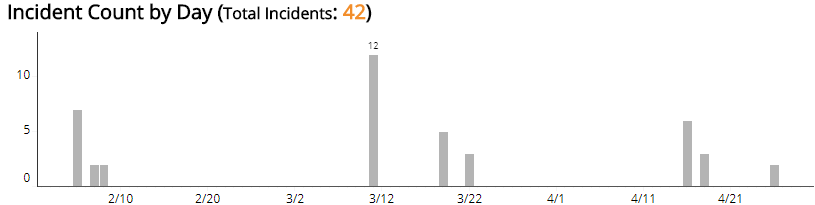
Incident Count by Day section
This section provides the daily incident count and the total count for the selected period.
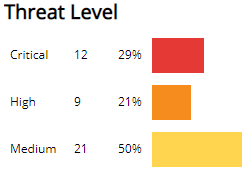
Threat Level section
This section displays the incident threat levels, the incident count for each threat level, and the percentage for each incident threat level in a color-coded bar graph in the selected filters.
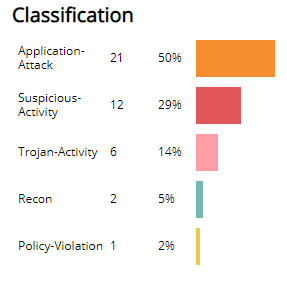
Classification section
This section displays the classifications of incidents, the count for each incident classification, and the percentage for each incident classification in a color-coded bar graph in the selected filters.
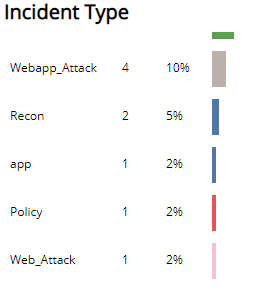
Incident Type section
This section displays the types of incidents, the count for each incident types, and the percentage for each incident type in a color-coded bar graph in the selected filters.
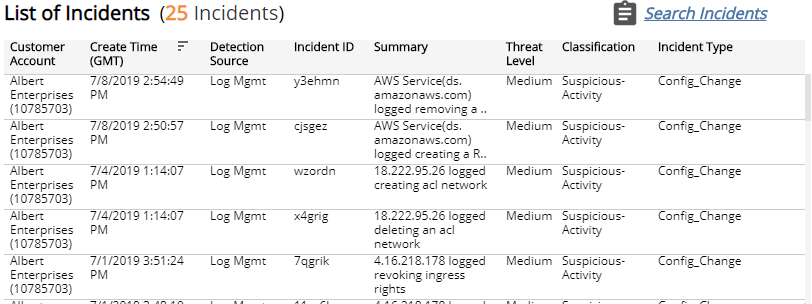
List of Incidents section
The list displays the log management incidents for the selected filters. The list is organized by date created, detection source, incident ID, summary, threat level, classification, and incident type.
Click Search Incidents to be redirected to the Incidents Lists page, which contains more information about the incidents in the selected period.