Incidents Details
Click a row in the incident list to view the details of any incident in the list. Incident details appear on the Investigation Report, Recommended Course of Action, and Evidence pages. The information provided helps you decide whether to update, close, snooze, or reopen an incident. You can also respond to an incident from the incident details.
The incident details page consists of the following tabs:
Incident actions
The incident details page provides you with information that helps you determine what action to take for each incident. Each incident on the list allows you to preview the incident, or open the incident to view the Investigation Report, Recommended Course of Action, or Evidence. All views allow you to take certain actions to address the incident.
Update an incident
Update ( ) allows you to choose from a list of options to update an incident with your assessment of the threat, and add an optional note to provide additional details about your update.
The following Threat Assessment options inform others in your organization whether the threat is valid, and what action (if any) the organization should take to remediate the threat.
Threat presents a valid risk:
- Taking action to mitigate the threat.
- Risk is acceptable. No action required.
Threat does not present a valid risk:
- Compensating control in place. No action required.
- The threat is not valid.
- Other assessment.
You can also mark the incident as Not concluded yet.
If you provide an update for an incident, you inform others in your organization about the status of the incident, and they can read detailed notes about any actions taken.
If you update an incident, the incident remains open.
Snooze an incident
Snooze ( ) allows you to temporarily remove an incident from the list until you remediate and close the incident. Snooze appears on the Investigation Report, Recommendations, and Evidence pages.
To snooze an incident:
- Select from the snooze options (tomorrow, in a couple days, next week, or in two weeks) when to return the incident to the Incident List.
- Add an optional note about the incident.
- Click Snooze.
You can click the Snoozed icon ( ) to edit your snooze options, or to cancel the snooze and return the incident to the list.
Close an incident
The option to close an incident appears on the Investigation Report, Recommendations, and Evidence pages. When you close an incident, you remove it from the list.
Click Close ( ) to close an incident.
Fill out the following information to justify closing the incident:
- Your assessment of the threat.
The following Threat Assessment options inform others in your organization whether the threat is valid, and what action (if any) the organization should take to remediate the threat.
Threat presents a valid risk:
- Taking action to mitigate the threat.
- Risk is acceptable. No action required.
Threat does not present a valid risk:
- Compensating control in place. No action required.
- The threat is not valid.
- Other assessment.
- Notes about the incident, including your reasons for closing the incident, and any steps taken to address the threat.
Respond to an incident with a simple response manually
You can run a simple response manually on an incident from the incident details page. Typical reasons for responding manually include:
- Testing a simple response before you activate it
- Running a simple response, even if you do not want it to trigger automatically
- Running a new simple response retroactively on an old incident
A simple response that is compatible with the incident's analytic must already be configured. However, the analytic does not have to be selected as an automatic trigger in the simple response.
For more information about simple responses, see Get Started with Simple Responses.
To run a simple response from an incident:
- In the incident list, click the incident that you want to respond to with a simple response.
- Click the Respond icon (
 ).
). - Click Run Simple Response.
- In Simple Response, select the simple response that you want to run on the incident.
Add a simple response
If you want Alert Logic to respond automatically to future incidents triggered by a selected incident's analytic, you can add a simple response from the incident details page. For more information about simple responses, see Get Started with Simple Responses.
To add a simple response from an incident:
- In the incident list, click the incident for which you want to add a simple response.
- Click the Respond icon ().
- Click Add Simple Response.
- In the Create a Simple Response page, find the relevant simple response, and then click START.
A message informs you if the analytic is not available for the selected simple response. An analytic may not be available because it does not produce a consistent response target, would not be applicable to any simple response, or summarizes many independent security events.
- Configure the simple response. For instructions, see the relevant guide in the Simple Response Configuration Guide.
Investigation and Recommendation
The Investigation and Recommendation tab includes the Investigation Report, Evidence Timeline, and Recommended Course of Action sections.
Investigation Report
When you open an incident from the Incident List page, you are taken to the Investigation Report. This page provides you with an attack summary and various details, including threat rating, target, attacker, and connection type. Utilize the page to gain a more detailed, while still relatively high-level, understanding of the incident.
For incidents with geographical data (for example, a geographically anomalous login), the Attack Summary section includes a baseline map that you can use to compare baseline and outlier activity.
For Log Review incidents, the Investigation and Recommendation tab also includes the Overview of Log Alerts and Anomalies section. The Overview of Log Alerts and Anomalies section is a briefing of the evidence. You can review the evidence in more detail from the Evidence tab, which includes a table-style list view for evidence.
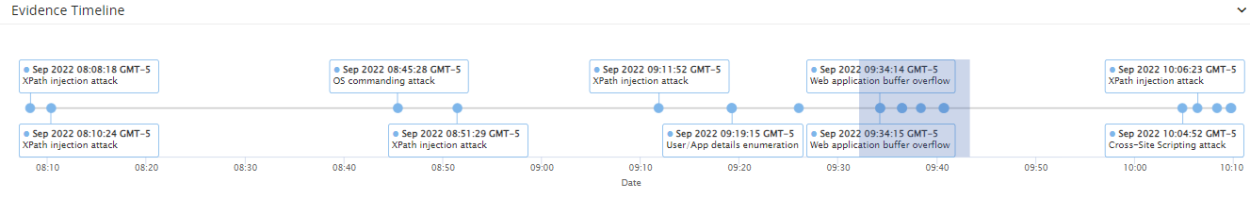
Evidence Timeline
The evidence timeline is a visual representation of the activity that culminated into an incident. Tooltips provide details about specific evidence. You can zoom in on an area of the timeline to display more details and then reset the zoom to the original view.
To zoom in or out in the timeline:
- In the Evidence Timeline section of the Investigation Report, select the area of interest to highlight it:
When you finish the selection, the timeline shows more details in the zoomed in area, and a message indicates the number of activities currently displayed:
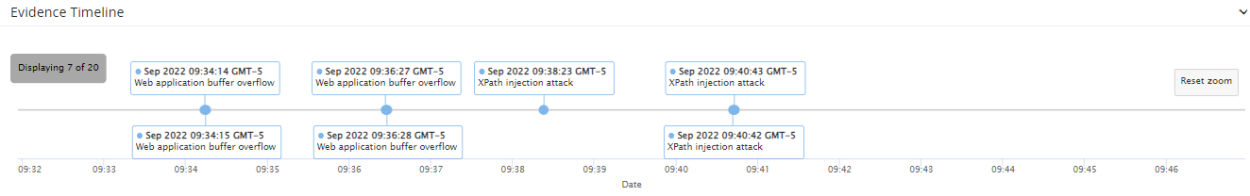
-
To reset the view to the original zoom, click Reset zoom.
Recommended Course of Action
Recommendations provides one or more courses of action you should take to secure the asset under attack and remediate the incident. In addition, the Audit Log lists the activity for the selected incident.
After you perform the recommended courses of action, click Close to mark the incident as closed and clear it from the list. For more information about closing incidents, see Close an incident.
Audit Log
The Audit Log, which appears as a preview bar in the top right of the Investigation Recommendations tab, uses the following icons to display milestone actions and information about the selected incident:
-
 Flagged evidence—Alert Logic analysts can flag items of interest as supporting evidence for the attack and provide notes specific to each flagged item.
 -
 System-generated event—This indicates the creation of the incident, or that the threat rating of the incident changed. The color and shading of the icon corresponds with the threat rating, as seen in About threat levels.
 -
 Incident notes from Alert Logic—An Alert Logic analyst can provide notes about the incident, which appear in the Audit Log and Evidence List.
 -
 Incident escalated to customer—The incident escalation icon indicates that Alert Logic notified you by email that the incident escalated. The color of the icon corresponds with the incident threat rating, as seen in About threat levels.
 -
 Customer notes—Any notes you create about the incident appear in this section.
The Audit Log information is similar to that of the Evidence tab, but does not include the incident activity. Click Evidence for more information about incident activity.
Incident Topology
The Incident Topology tab shows the relationship of assets involved in the incident. Click on an item for additional details.
Evidence
The Evidence tab groups related information, including events, correspondence, and activity that culminated into an incident, into one drop-down section that you can collapse and expand. Click the drop-down arrow (![]() ) to see all of the evidence listed under an event.
) to see all of the evidence listed under an event.
If there are more than 100 evidences for an activity related to an incident, the additional evidence will automatically load. After the additional evidence loads, click REFRESH to see the new evidence. This will refresh the page to show the following 100 (or remaining) evidence.
You can use the search bar to search for keywords to find specific information. Click Download All to download all the evidence for all information in this incident, including events, correspondence and activity.
The Evidence page uses the following icons to display the following information about the selected incident
-
 Incident activity—The Incident Activity icon lists activity and logs associated with the selected incident. The numeral on the icon represents the number of activities associated with the attack. Click the icon to expand the section and reveal details about the attack and the assets involved, as well as all activity and logs for the incident.
 -
Flagged evidence—Alert Logic analysts can flag items of interest as supporting evidence for the attack and provide notes specific to each flagged item.
-
System-generated event—This indicates the creation of the incident, or that the threat rating of the incident changed. The color and shading of the icon corresponds with the threat rating, as seen in About threat levels.
-
Incident notes from Alert Logic—An Alert Logic analyst can provide notes about the incident, which appear in the Audit Log and Evidence List.
-
Incident escalated to customer—The incident escalation icon indicates that Alert Logic notified you by email that the incident escalated. The color of the icon corresponds with the incident threat rating, as seen in About threat levels.
-
Customer notes—Any notes you create about the incident appear in this section.
Click the incident activity icon (![]() ) to view the events most relevant to the selected incident. If the incident is an IDS incident, and if you want to analyze all incident events, you can download (
) to view the events most relevant to the selected incident. If the incident is an IDS incident, and if you want to analyze all incident events, you can download (![]() ) all the incident event information to a PCAP file, which you can view in a third-party PCAP analyzer, such as Wireshark.
) all the incident event information to a PCAP file, which you can view in a third-party PCAP analyzer, such as Wireshark.
Activity grouping
You can also find other relevant information nested under each activity, and these include log messages for Log Management detection sources and observations for Web Log Analytics (WLA) and Log Review detection sources. Alert Logic notes these anomalies as relevant security information that can demonstrate security value. Click the drop-down arrow (![]() ) next to an anomaly to see more details.
) next to an anomaly to see more details.
The table-style list that supports the activity under an event functions the same way as the new incident list. You can select which columns to see, adjust the column size, remove and add columns, and drag and drop columns into the order you want. This flexibility allows you to easily navigate through information to determine how to address incidents more quickly.
For Log Review incidents associated with anomaly or rule-based findings, you can download a CSV file of the observations or facts for an event. The aggregator summary section groups observation findings and evidence for different message types which allows you to download evidence for specific aggregator types to a CSV file for compliance needs. The file contains information fields from observations or facts from all of the log messages associated with the anomaly findings.
To download observation findings, click the drop-down arrow (![]() ) next to the event grouping to expand details, and then click Download Observations. To download additional data associated with the observations, click Download Observation Evidence. The CSV file for observations contains the following fields:
) next to the event grouping to expand details, and then click Download Observations. To download additional data associated with the observations, click Download Observation Evidence. The CSV file for observations contains the following fields:
- Summary
- Date
- Description
- Severity
- Customer name
- Caller user
- Log source
- Maximum time
- Message type
- Minimum time
- Terminal time
- Total messages
- Aggregator entity type
- User
You can investigate further and download the facts of an observation event under the Log Review event grouping. To download facts of an observation event, click the drop-down arrow (![]() ) to expand the details of an observation, and then click Download Facts. The CSV file for the observation facts includes the following fields:
) to expand the details of an observation, and then click Download Facts. The CSV file for the observation facts includes the following fields:
- Description
- Date
- Message
- User
- Facility and priority
- Syslog fields PID
- UID
- User name
Analytic Details
The analytic details tab includes details for the underlying security content logic for defining the activity as an incident. To learn more about analytics, see About Analytics in the Threat Intelligence Center.
Incident notifications
The Notifications feature in the Alert Logic console can alert you, other subscribed users, or a third-party application when incidents that meet specific criteria occur. Notifications to a third-party application require a templated connection.Notifications allow you to know about, and respond quickly to, threats or changes in your environment. In addition, email notifications for escalated incidents include that notes the Alert Logic analyst provided in the Incidents page.
To set up incident notifications, click ![]() NOTIFICATIONS at the top right, and then click Add Notification. For more information, see Incident Notifications.
NOTIFICATIONS at the top right, and then click Add Notification. For more information, see Incident Notifications.