Web Log Analytics (WLA) Configuration
Alert Logic Web Log Analytics (WLA) is a log-based application attack detection solution that protects your web applications from common application vulnerabilities. WLA reduces the need for tuning and minimizes false-positives using a combination of a machine learning-based analysis and detection engine and signatures. To learn more about WLA, see About Alert Logic Web Log Analytics (WLA).
Alert Logic generates incidents detected from WLA in the Incidents page. You can also search for WLA logs in the Search page in the Alert Logic console. You can access the Web Log Analytics Dashboard, which provides visibility into incidents and observations detected from WLA in your environment.
Before you configure WLA access log
To deploy WLA, you must have a Managed Detection and Response Professional or Enterprise subscription. To learn more about Alert Logic Managed Detection and Response products, see Get Started with Alert Logic Subscriptions and Add-ons. WLA currently supports log formats from IIS, Apache2, and Nginx web servers.
You must have an Alert Logic agent or a local remote collector already installed. If you do not have either one already installed, you can do so before you begin deploying WLA. For more information about agents, see Install the Alert Logic Agent for Linux, Install the Alert Logic Agent for Windows, or Automate Alert Logic Agent Installation with AWS Systems Manager Distributor. For more information about Alert Logic remote collectors, see Install the Remote Collector for Linux and Install the Remote Collector for Windows.
Linux users who want to collect syslogs must forward their local syslog to the agent on TCP port 1514.
Alert Logic recommends you also have the following prepared before deploying WLA:
- All application fully qualified domain names in scope for protection
- List of servers per application
- File system locations of application log files on each server
- Configured proxies, content delivery networks (CDNs), load balancers, or other relevant upstream network systems that insert the X-Forwarded-For header
For large environments, Alert Logic recommends that you use a Alert Logic Managed Web Application Firewall (WAF). For more information, see Alert Logic Managed Web Application Firewall (WAF) Basics.
IIS 8.5/10 WLA access log configuration
WLA supports Microsoft W3C log formats. As described in the following procedure, enable all default fields except cs(Cookie) and at least two custom fields.
To deploy WLA on an IIS web server:
- Go to Server Manager, click the Tools menu, and then click Internet Information Services (IIS) Manager. For more information about how to access IIS Manager, see Configure Logging in IIS.
- On the left pane, in Connections, select the web server for which you are configuring server-wide default fields for logging.If you prefer to configure logging for each website on the host individually, select a website instead, and then repeat this procedure for each website.
- In the view to the right, double-click Logging.
- On the Logging page, in the Log file section under Format, select W3C as the log file format.
- Ensure that the Directory field is SystemDrive%\inetpub\logs\LogFiles.
- Click Select Fields.
- In the W3C Logging Fields dialog box, select all fields, except cs(Cookie).
- Under Custom Fields, click Add Field.
- Add the Content-Type Header custom field:
- In Field Name, type Content-Type for the Content-Type Header.
- For the Source Type, select Request Header.
- For Source, select Content-Type.
- Add the X-Forwarded-For Header custom field:
- In Field Name, type X-Forwarded-For for the X-Forwarded-For Header.
- For the Source Type, select Request Header.
- For Source, type X-Forwarded-For.
The following image shows the expected result:
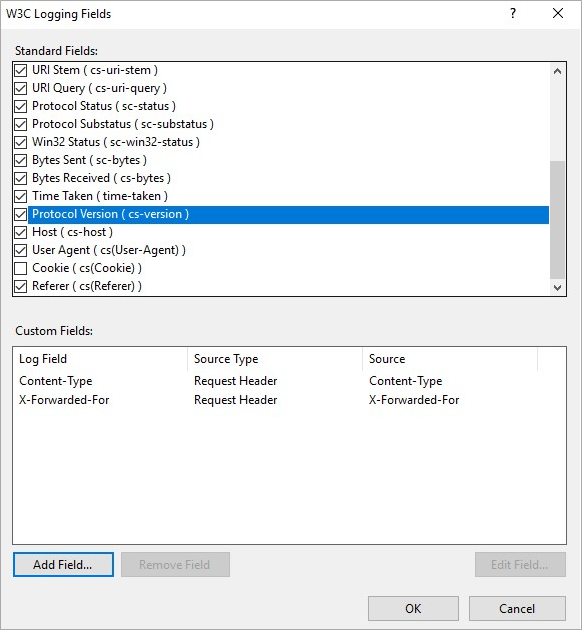
- Click OK, and then click Apply.
- Configure collection of IIS logs in the Alert Logic console:
- From the navigation menu, click
 Configure, click Deployments, and then click the deployment for which you want to configure collection.
 - On the left panel, click Logs, click Application Logs, and then click the add icon (
 ).
). - Select Microsoft Internet Information Services, and then type an application name. Alert Logic configures the other settings for you.If you previously logged to the folder without customizing the W3C log settings and then added the two fields required, two streams of filenames will match *.log. Either clear out the older filenames or enter a more specific pattern in File Name or Pattern (for example, u_ex*x.log).
- Click SAVE AND NEXT, and then apply the Application Log collection to the chosen Asset scope.
For more information about the Application Logs page, see Application Logs for Flat File Configuration.
- From the navigation menu, click
- Wait five to 10 minutes for logs to register in the Alert Logic console. To confirm that you are collecting logs, go to the Search page in the Alert Logic console, and insert the following search string:
[Message Type] CONTAINS "IIS"For more information about the Search page, see Get Started with Search.
Apache Tomcat web server WLA access log configuration
WLA supports Tomcat common and combined access log formats. You must use Tomcat version 7 or greater and have sudo/root access to modify the Tomcat server configuration.
To deploy WLA on an Apache Tomcat web server:
- Locate the server.xml file (default location is $CATALINA_HOME/conf/server.xml)
- Update “pattern” attribute of the Server.Engine.Valve object for Access Logging with the wla_access_log format:
"@WLALOG "%{YYYY-MM-dd}tT%{HH:mm:ss}t.%{msec_frac}t%{z}t", "%{Host}i", "%a", "%{X-Forwarded-For}i", "%m", "%U%q", "%s", "%B", "%{Content-Length}i", "%{Referer}i", "%{User-Agent}i", "%{Content-Type}i""Linux Apache2 WLA access log configuration
WLA supports Apache Common Log Format and Combined Log Format. Alert Logic provides the custom wla_access_log format to use with Apache, which includes all of the recommended fields. If you chose not to use the wla_access_log format, you must ensure the maximum security value fields are added to existing log format configurations.
To deploy WLA on a Linux Apache2 web server:
- Access the CLI of the host you want to configure. You can use Secure Shell (SSH) or any other appropriate CLI.
You must have sudo/root access to modify the Apache2 configuration and review local access log messages.
- Locate the appropriate configuration file for the application you want to protect. The file is usually located in /etc/httpd/conf/httpd.conf.Steps and examples in this procedure are for RPM based OS. For Debian based OS, the file is usually located in /etc/apache2/sites-available/. If only one website is hosted on the server, the file is located in /etc/apache2/apache2.conf.
- Open the configuration file for editing, and then find the LogFormat directive.
- Replace the existing log format with the Alert Logic wla_access_log format or add the recommended fields to your existing configuration.
Example of the wla_access_log format for HTTPD version greater than or equal to 2.2.30:
LogFormat "@WLALOG \"%{%Y-%m-%dT%T}t.%{msec_frac}t%{%z}t\", \"%{host}i\", \"%a\", \"%{x-forwarded-for}i\", \"%m\", \"%U%q\", \"%>s\", \"%b\", \"%{content-length}i\", \"%{referer}i\", \"%{user-agent}i\", \"%{content-type}i\"" wla_access_logExample of the wla_access_log format for HTTPD version less than 2.2.30:
LogFormat "@WLALOG \"%{%Y-%m-%dT%T}t%{%z}t\", \"%{host}i\", \"%a\", \"%{x-forwarded-for}i\", \"%m\", \"%U%q\", \"%>s\", \"%b\", \"%{content-length}i\", \"%{referer}i\", \"%{user-agent}i\", \"%{content-type}i\"" wla_access_logExample of Combined Log Format:
LogFormat "%h %l %u %t \"%r\" %>s %b \"%{Referer}i\" \"%{User-agent}i\" \"%{X-Forwarded-For}i\"" combined_proxy - You must add a new line at the bottom of the configuration file to ensure the new LogFormat is applied and logged to the correct file. In the example below, the LogFormat was added to line 8, and the new line was added to line 29 under
logs/access_log.This example is based on an RPM based OS. Use your CustomLog path for line 29. - Save and close the file.
- Restart your Apache service.
- Verify the generation of WLA logs with:
tail -n 25 /path/to/CustomLog
- Configure flat file collection from the Application Logs page in the Alert Logic console. When you add the application log, enter these values:
- For Application File Path: The path is usually /var/log/httpd. For Debian based OS, the path is usually /var/log/apache2.
- For File Name or Pattern: access_log
For more information, see Configure a flat file collector in the Alert Logic console.
- For Application File Path: The path is usually /var/log/httpd.
- Wait five to 10 minutes for access logs to register in the Alert Logic console. Confirm log messages contain values for host and vhost client IP, XFF, referer, and user agent to verify your host configurations. For more information, see Search log confirmation in the Alert Logic console.
<IfModule log_config_module>
#
# The following directives define some format nicknames for use with
# a CustomLog directive (see below).
#
LogFormat "%h %l %u %t \"%r\" %>s %b \"%{Referer}i\" \"%{User-Agent}i\"" combined
LogFormat "%h %l %u %t \"%r\" %>s %b" common
LogFormat "@WLALOG \"%{%Y-%m-%dT%T}t.%{msec_frac}t%{%z}t\", \"%{host}i\", \"%a\", \"%{x-forwarded-for}i\", \"%m\", \"%U%q\", \"%>s\", \"%b\", \"%{content-length}i\", \"%{referer}i\", \"%{user-agent}i\", \"%{content-type}i\"" wla_access_log
<IfModule logio_module>
# You need to enable mod_logio.c to use %I and %O
LogFormat "%h %l %u %t \"%r\" %>s %b \"%{Referer}i\" \"%{User-Agent}i\" %I %O" combinedio
</IfModule>
#
# The location and format of the access logfile (Common Logfile Format).
# If you do not define any access logfiles within a <VirtualHost>
# container, they will be logged here. Contrariwise, if you *do*
# define per-<VirtualHost> access logfiles, transactions will be
# logged therein and *not* in this file.
#
#CustomLog "logs/access_log" common
#
# If you prefer a logfile with access, agent, and referer information
# (Combined Logfile Format) you can use the following directive.
#
# CustomLog "logs/access_log" combined
CustomLog "logs/access_log" wla_access_log
</IfModule>Linux Nginx WLA access log configuration
WLA supports Nginx Common Log Format and Combined Log Format. Alert Logic provides the custom wla_access_log format to use with Nginx, which includes all of the recommended fields. If you chose not to use the wla_access_log format, you must ensure the maximum security value fields are added to existing log format configurations.
To deploy WLA on a Linux Nginx web server:
- Access the CLI of the host for which you want to configure. You can use Secure Shell (SSH) or any other appropriate CLI.
You must have sudo/root access to modify the Nginx configuration and review local access log messages.
- Locate the appropriate configuration file for the application you want to protect. The file is usually located in /etc/nginx/sites-available/. If only one website is hosted on the server, the file is located in /etc/nginx/nginx.conf.
- Open the configuration file for editing, and then find the log_format.
- Replace the existing log format with the Alert Logic wla_access_log format or add the recommended fields to your existing configuration.
Example of a wla_access_log:
map $time_iso8601 $time_iso8601_p1 {
~([^+]+) $1;
}
map $time_iso8601 $time_iso8601_p2 {
~\+([0-9:]+)$ $1;
}
map $msec $millisec {
~\.([0-9]+)$ $1;
}
log_format wla_access_log '@WLALOG "$time_iso8601_p1.$millisec+$time_iso8601_p2", '
'"$http_host", "$remote_addr", '
'"$http_x_forwarded_for", "$request_method", '
'"$request_uri", "$status", "$body_bytes_sent", '
'"$http_content_length", "$http_referer", '
'"$http_user_agent", "$http_content_type"';Example of a Combined Log Format:
log_format combined_proxy '$remote_addr - $remote_user [$time_local] '
'"$request" $status $body_bytes_sent '
'"$http_referer" "$http_user_agent" '
'"$http_x_forwarded_for"'; - You must edit the file to ensure the new log_format is logged to the correct file. You must modify or add the following line access_log /var/log/nginx/access.log wla_access_log; as the main line. Your file will look similar to the example below.
http {
    #    log_format  main  '$remote_addr - $remote_user [$time_local] "$request" '
    #                      '$status $body_bytes_sent "$http_referer" '
    #                      '"$http_user_agent" "$http_x_forwarded_for"';

    map $time_iso8601 $time_iso8601_p1 {
        ~([^+]+) $1;
    }
    map $time_iso8601 $time_iso8601_p2 {
        ~\+([0-9:]+)$ $1;
    }
    map $msec $millisec {
        ~\.([0-9]+)$ $1;
    }

    log_format wla_access_log '@WLALOG "$time_iso8601_p1.$millisec+$time_iso8601_p2", '
    '"$http_host", "$remote_addr", '
    '"$http_x_forwarded_for", "$request_method", '
    '"$request_uri", "$status", "$body_bytes_sent", '
    '"$http_content_length", "$http_referer", '
    '"$http_user_agent", "$http_content_type"';

access_log /var/log/nginx/access.log wla_access_log; - Save and close the file.
- Restart the Nginx service.
- Configure flat file collection from the Application Logs page in the Alert Logic console. When you add the application log, enter these values:
- For Application File Path: /var/log/nginx
- For File Name or Pattern: access.log
For more information, see Configure a flat file collector in the Alert Logic console.
- Wait five to 10 minutes for access logs to register in the Alert Logic console. Confirm log messages contain values for host and vhost client IP, XFF, referer, and user agent to verify your host configurations. For more information, see Search log confirmation in the Alert Logic console.
Configure a flat file collector in the Alert Logic console
You must configure a collection method and policy from the deployment from which you want to collect in the Alert Logic console. The collection method and policy you configure determine which flat file log messages to collect, how to separate log messages within a flat file, and how to read the time of each log message. Rules determine the asset tags, assets, or topology elements from which Alert Logic collects logs.
To access the log collection setup, from the navigation menu, click ![]() Configure, click Deployments, and then click the deployment for which you want to configure collection. On the left panel, click Logs, and then click Application Logs.
Configure, click Deployments, and then click the deployment for which you want to configure collection. On the left panel, click Logs, and then click Application Logs.
When you add the application log, see the instructions for WLA access log configuration relevant to your deployment's web server in this document for the values to enter in the Application File Path and File Name or Pattern fields.
For more information about the Application Logs page, see Application Logs for Flat File Configuration.
Search log confirmation in the Alert Logic console
To confirm that you are collecting logs and that they are configured for WLA, search for your messages on the Alert Logic console's Search page.
If you have an IIS web server properly configured, each "#Fields:" comment in its logs will appear in the Alert Logic console as records naming all the fields required by WLA. Find them by clicking this query to open the Search interface, expanding the time window for the search appropriately, and clicking the Search button.
If you have another kind of web server (nginx, Tomcat, etc.) properly configured, its logs will show up in the Alert Logic console with the message type of "WLA Access Log." Find them by clicking this query to open the Search interface, expanding the time window for the search appropriately, and clicking the Search button.
In either case, if there are no results, you may need to expand the time window, recheck your web server configurations to ensure all expected fields are logged, or reconfirm that log collection is enabled for your log source.
Once you have confirmed there are results, review the log entry timestamps to verify log collection, and review log entries to confirm inclusion of security value fields like host and vhost client IP, XFF, referer, and user agent. You may also want to confirm there are results for a specific log source by restricting your search further (e.g., adding to the WHERE clause: "AND log_source = 'Log Source Name'").
For more information about the Search page, see Get Started with Search.